By going through these Maharashtra State Board Class 11 Economics Notes Chapter 3 Partition Values students can recall all the concepts quickly.
Maharashtra State Board Class 11 Economics Notes Chapter 1 Basic Concepts in Economics
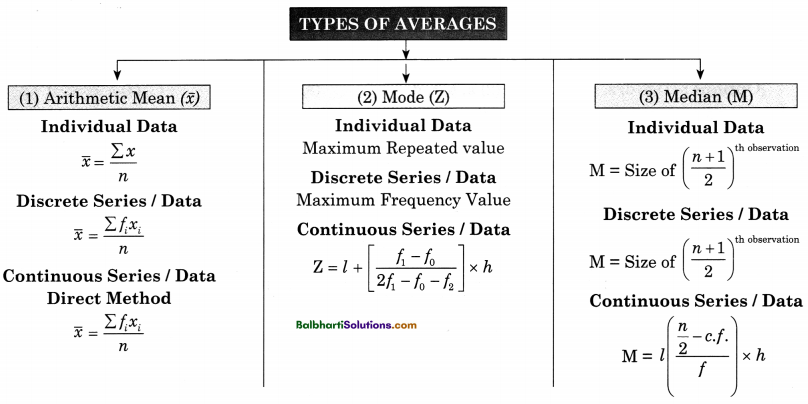
→ Types Of Averages:
(1) Arithmetic Mean ( \(\bar{x}\) ):
- Individual Data
\(\bar{x}=\frac{\sum x}{n}\) - Discrete Series / Data
\(\bar{x}=\frac{\sum f_{i} x_{i}}{n}\) - Continuous Series / Data Direct Method
\(\bar{x}=\frac{\sum f_{i} x_{i}}{n}\)
(2) Mode (Z):
- Individual Data
Maximum Repeated value - Discrete Series/ Data
Maximum Frequency Value - Continuous Series / Data
\(\mathrm{Z}=l+\left[\frac{f_{1}-f_{0}}{2 f_{1}-f_{0}-f_{2}}\right] \times h\)
(3) Median (M) :
- Individual Data
M = Size of \(\left(\frac{n+1}{2}\right)^{\text {th observation }}\) - Discrete Series I Data
M = Size of \(\left(\frac{n+1}{2}\right)^{\text {th observation }}\) - Continuous Series I Data
M = \(l\left(\frac{\frac{n}{2}-c . f .}{f}\right) \times h\)

![]()
→ 29th June is celebrated as “Statistics Day” in India to recognise the contributions of noted Indian
Statistician. Prof. Prasanta Chandra Mahalanobis.
→ Partition Values : Values which divide the data into required number of equal parts are called partition value or fractiles.
→ Partition Values:
- Percentiles
- Quartiles
- Median
- Deciles

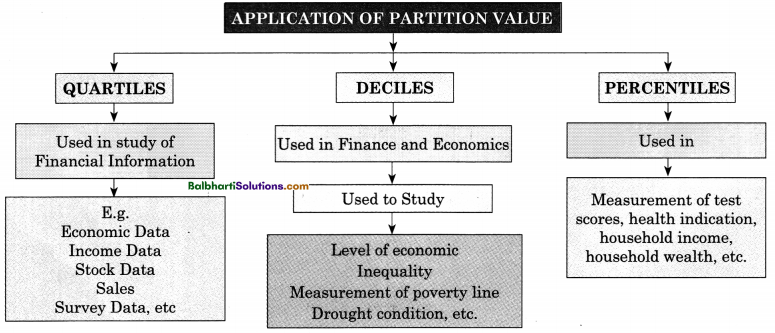
→ Application Of Partition Value:
- Quartiles
- Deciles
- Percentiles
Quartiles:
- Used in study of Financial Information
- E.g.
- Economic Data
- Income Data
- Stock Data
- Sales
- Survey Data, etc
Deciles:
Used in Finance and Economics
Used to Study:
- Level of economic
- Inequality
- Measurement of poverty line
- Drought cohdition, etc.
![]()
Percentiles:
Used in Measurement of test scores, health indication, household income, household wealth, etc.

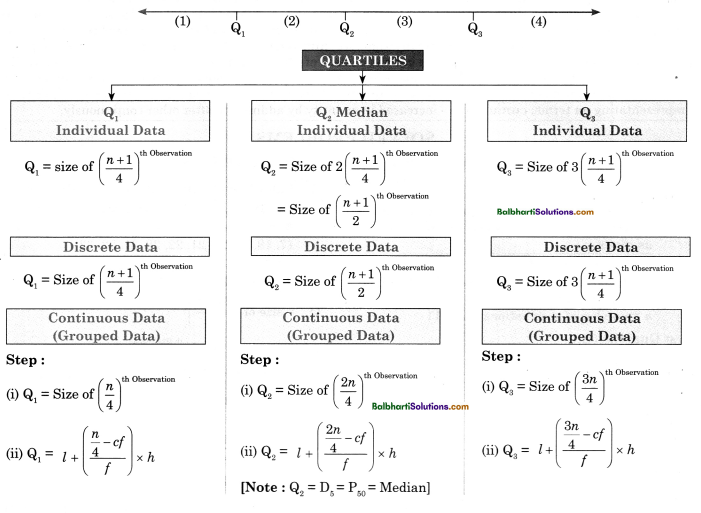
→ Quartiles : Quartiles are the values (data) which divide the series (distribution) into four equal parts. They are the 3 values that divide the distribution into 4 parts, each representing one quarters of the score. These 3 values are called as first quartile (Q1), second quartile (Q2) and third quartile (Q3). Second quartile is nothing but the median.
→ Quartiles
Q1 Individual Data:
Q1 = size of \(\left(\frac{n+1}{4}\right)^{\text {th observation }}\)
Discrete Data:
Q1 = size of \(\left(\frac{n+1}{4}\right)^{\text {th observation }}\)
Continuous Data (Grouped Data):
Step:
- Q1 = size of \(\left(\frac{n}{4}\right)^{\text {th observation }}\)
- Q1 = l + \(\left(\frac{\frac{n}{4}-c f}{f}\right)\) x h
Q2 Median Individual Data:
Q2 = size of \(\left(\frac{n+1}{4}\right)^{\text {th observation }}\)
= size of \(\left(\frac{n+1}{2}\right)^{\text {th observation }}\)
Discrete Data :
Q2 = size of \(\left(\frac{n+1}{2}\right)^{\text {th observation }}\)
Continuous Data (Grouped Data):
Step:
- Q2 = size of \(\left(\frac{2n}{4}\right)^{\text {th observation }}\)
- Q2 = l + \(\left(\frac{\frac{2 n}{4}-c f}{f}\right)\) x h
[Note : Q2 = D5 = P50 Median]
Q3 Individual Data:
Q3 = size of 3\(\left(\frac{n+1}{4}\right)^{\text {th observation }}\)
Discrete Data:
Q3 = size of 3\(\left(\frac{n+1}{4}\right)^{\text {th observation }}\)
Continuous Data (Grouped Data):
Step:
- Q3 = size of \(\left(\frac{3 n}{4}\right)^{\text {th } \text { Observation }}\)
- Q3 = l + \(\left(\frac{\frac{3 n}{4}-c f}{f}\right)\) x h

![]()
→ Deciles : They are the values of data which divide the whole set of observations into 10 equal parts. There are 9 points i.e. , D1, D2 to D9 which divide the data into 10 equal parts. While calculating Deciles, data has to be arranged in ascending or descending order.
- Individual Data : \(\mathrm{D}_{j}=j\left(\frac{n+1}{10}\right)^{\text {th } \text { Observation }}\) [where j = 1,2, ……..9]
- Continuous Data : \(\mathrm{D}_{j}=l+\left(\frac{\frac{j n}{10}-c f}{f}\right) \times h\) [where j = 1,2, ………….9]
→ Percentiles : It divides the whole set of observations into 100 equal parts. There are 99 percentile.
They are denoted by P1, P2 to P3 ………….. P99 The 50th percentile is called as Median.
(i) Individual Data and Discrete Data : Pk = size of k \(\left(\frac{n+1}{100}\right)^{\text {th observation }}\) [Where k = 1, 2, ……………99]
(ii) Continuous Data : Pk = l + \(\left(\frac{\frac{k n}{100}-c f}{f}\right)\) x h [Where k = 1, 2, ……………99]
Word Meaning:
procedure – steps; arithmetic – study of numbers; mean – average; median – middle; quartiles – divided into four equal groups; deciles – divided into 10 equal groups; percentiles – divided into 100 equal groups; descriptive – to describe; poverty – poor; acquainted – to get to known; statistical – use of statistics; magnitude – in great extent; misinterprets – misunderstand; survey – observe; fluctuations – changes; inflation – increase in price; povertyline – minimum required income to get basic needs of life; drought – no rainfall in an area; portfolio investments – range of investments; bench marking – measuring the performance; baseline – minimum way tci compare; observations – the data in numbers; frequency distribution – mathematical function; symbolically – representating in terms; cumulative – increased in quantity by adding one after other continuously.