9th Standard Maths 1 Practice Set 7.3 Chapter 7 Statistics Textbook Answers Maharashtra Board
Balbharti Maharashtra State Board Class 9 Maths Solutions covers the Practice Set 7.3 Algebra 9th Class Maths Part 1 Answers Solutions Chapter 7 Statistics.
Class 9 Maths Part 1 Practice Set 7.3 Chapter 7 Statistics Questions With Answers Maharashtra Board
Question 1.
For class interval 20 – 25 write the lower class limit and the upper class limit.
Answer:
Lower class limit = 20
Upper class limit = 25
Question 2.
Find the class-mark of the class 35-40.
Solution:
Class-mark
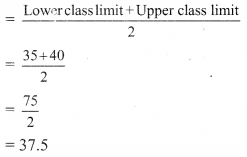
∴ Class-mark of the class 35 – 40 is 37.5
Question 3.
If class-mark is 10 and class width is 6, then find the class.
Solution:
Let the upper class limit be x and the lower class limit be y.
Class mark = 10 …[Given]
Class-mark
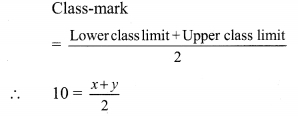
∴ x + y = 20 …(i)
Class width = 6 … [Given]
Class width = Upper class limit – Lower class limit
∴ x – y = 6 …(ii)
Adding equations (i) and (ii),
x + y = 20
x – y = 6
2x = 26
∴ x = 13
Substituting x = 13 in equation (i),
13 + y = 20
∴ y = 20 – 13
∴ y = 7
∴ The required class is 7 – 13.
Question 4.
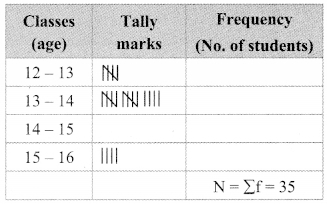
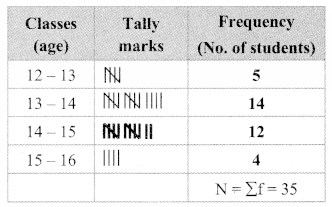
Complete the following table.
Solution:
Let frequency of the class 14 – 15 be x then, from table,
5 + 14 + x + 4 = 35
∴ 23 + x = 35
∴ x = 35 – 23
∴ x = 12
Question 5.
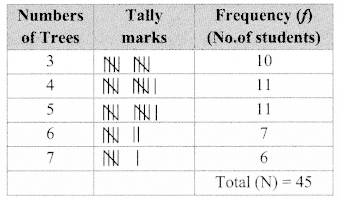
In a ‘tree plantation’ project of a certain school there are 45 students of ‘Harit Sena.’ The record of trees planted by each student is given below:
3, 5, 7, 6, 4, 3, 5, 4, 3, 5, 4, 7, 5, 3, 6, 6, 5, 3, 4, 5, 7, 3, 5, 6, 4, 4, 3, 5, 6, 6, 4, 3, 5 ,7, 3, 4, 5, 7, 6, 4, 3, 5, 4, 4, 7.
Prepare a frequency distribution table of the data.
Solution:
Question 6.
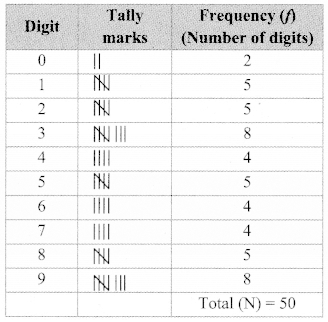
The value of n upto 50 decimal places is given below:
3.14159265358979323846264338327950288419716939937510
From this information prepare an ungrouped frequency distribution table of digits appearing after the decimal point.
Solution:
Question 7.
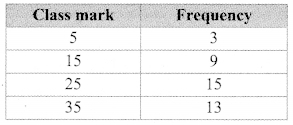
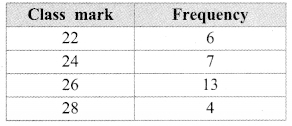
In the tables given below, class-mark and frequencies is given. Construct the frequency tables taking inclusive and exclusive classes.
i.
ii.
Solution:
i. Let the Lower class limit and upper class limit of the class mark 5 be x and y respectively.
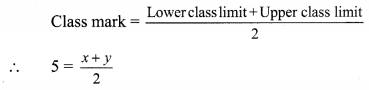
∴x + y = 10
Here, class width = 15 – 5 = 10
But, Class width = Upper class limit – Lower class limit
∴ y – x = 10
∴ -x + y = 10 …(ii)
Adding equations (i) and (ii),
x+ y = 10
-x + y = 10
∴ 2y = 20
∴ y = 10
Substituting y = 10 in equation (i),
∴ x + 10 = 10
∴ x = 0
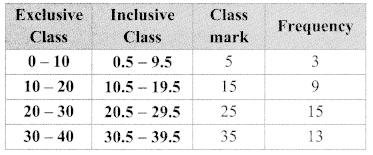
∴ class with class-mark 5 is 0 – 10
Similarly, we can find the remaining classes.
∴ frequency table taking inclusive and exclusive classes.
ii. Let the lower class limit and upper class limit of the class mark 22 be x andy respectively.
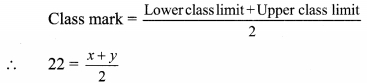
∴ x + y = 44 …(i)
Here, class width = 24 – 22 = 2
But, Class width = Upper class limit – Lower class limit
∴ y – x = 2
∴ -x + y = 2 …. (ii)
Adding equations (i) and (ii),
x + y = 44
– x + y= 2
2y = 46
∴ y = 23
Substituting y = 23 in equation (i),
∴ x + 23 = 44
∴ x = 21
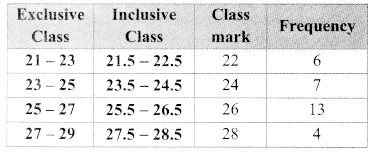
∴ class with class-mark 22 is 21 – 23
Similarly, we can find the remaining classes
∴ frequency table taking inclusive and exclusive classes.
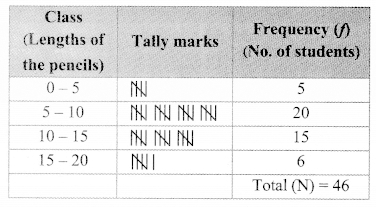
Question 8.
In a school, 46 students of 9th standard, were told to measure the lengths of the pencils in their compass-boxes in Centimetres. The data collected was as follows:
16, 15, 7, 4.5, 8.5, 5.5, 5, 6.5, 6, 10, 12, 13,
4.5, 4.9, 16, 11, 9.2, 7.3, 11.4, 12.7, 13.9, 16,
5.5, 9.9, 8.4, 11.4, 13.1, 15, 4.8, 10, 7.5, 8.5,
6.5, 7.2, 4.5, 5.7, 16, 5.7, 6.9, 8.9, 9.2, 10.2, 12.3, 13.7, 14.5, 10
By taking exclusive classes 0-5, 5-10, 10-15,…. prepare a grouped frequency distribution table.
Solution:
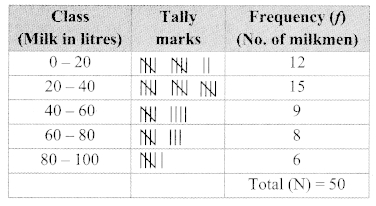
Question 9.
In a village, the milk was collected from 50 milkmen at a collection center in litres as given below:
27, 75, 5, 99, 70, 12, 15, 20, 30, 35, 45, 80, 77,
90, 92, 72, 4, 33, 22, 15, 20, 28, 29, 14, 16, 20,
72, 81, 85, 10, 16, 9, 25, 23, 26, 46, 55, 56, 66,
67, 51, 57, 44, 43, 6, 65, 42, 36, 7, 35
By taking suitable classes, prepare grouped frequency distribution table.
Solution:
Question 10.
38 people donated to an organisation working for differently abled persons. The amount in rupees were as follows:
101, 500, 401, 201, 301, 160, 210, 125, 175,
190, 450, 151, 101, 351, 251, 451, 151, 260,
360, 410, 150, 125, 161, 195, 351, 170, 225,
260, 290, 310, 360, 425, 420, 100, 105, 170, 250, 100
i. By taking classes 100 – 149, 150 – 199, 200 – 249… prepare grouped frequency distribution table.
ii. From the table, find the number of people who donated ₹350 or more.
Solution:
i.
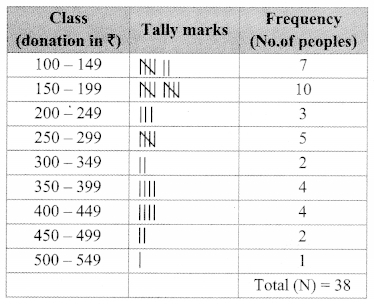
ii. Number of people who donated ₹ 350 or more = 4 + 4 + 2 + 1 = 11
Maharashtra Board Class 9 Maths Chapter 7 Statistics Practice Set 7.3 Intext Questions and Activities
Question 1.
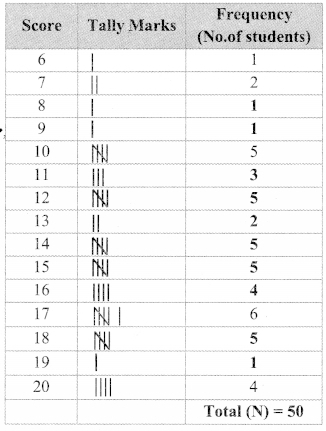
The record of marks out of 20 in Mathematics in the first unit test is as follows:
20,6, 14, 10, 13, 15, 12, 14, 17. 17, 18, 1119,
9, 16. 18, 14, 7, 17, 20, 8, 15, 16, 10, 15, 12.
18, 17, 12, 11, 11, 10, 16, 14, 16, 18, 10, 7, 17,
14, 20, 17, 13, 15, 18, 20, 12, 12, 15, 10
Answer the following questions, from the above information.
a. How many students scored 15 marks?
b. How many students scored more than 15 marks?
c. How many students scored less than 15 marks?
d. What is the lowest score of the group?
e. What is the highest score of the group? (Textbook pg. no. 114)
Solution:
a. 5 students scored 15 marks.
b. 20 students scored more than 15 marks.
c. 25 students scored less than 15 marks.
d. 6 is the lowest score of the group.
e. 20 is the highest score of the group.
Question 2.
For the above Question prepare Frequency Distribution Table. (Textbook pg. no. 115)
Solution:
Maharashtra Board Class 9 Maths Solutions
- Statistics Practice Set 7.1 Class 9 Maths Solutions
- Statistics Practice Set 7.2 Class 9 Maths Solutions
- Statistics Practice Set 7.3 Class 9 Maths Solutions
- Statistics Practice Set 7.4 Class 9 Maths Solutions
- Statistics Practice Set 7.5 Class 9 Maths Solutions
- Statistics Problem Set 7 Class 9 Maths Solutions