By going through these Maharashtra State Board Book Keeping & Accountancy Notes 12th Chapter 9 Analysis of Financial Statements students can recall all the concepts quickly.
Maharashtra State Board 12th Accounts Notes Chapter 9 Analysis of Financial Statements
Meaning, Objective and Limitations of Financial Statement Analysis-
Meaning: The statements which are prepared by the business enterprises periodically to ascertain or measure the profitability, operational efficiency, solvency, growth of the business concern and judge the financial strength and status are called financial statements. These statements furnish a complete picture of the firm’s financial conditions and managerial performance. The financial statements are prepared by the profit concerns as well as ‘non-profit’ concerns usually at the end of the financial year. The financial statements of the business enterprises for an accounting period consist of the following :
(1) Balance Sheet/A position statement (2) Profit and Loss A/c/An Income statement.
Financial statement analysis is a study of financial relationship among the various financial items (factors) and the trend revealed in the financial statements. Thus, analysis of financial statements involves collection and a methodical classification of the data given in the financial statement and a comparison of various figures with each other. Financial statement analysis involves two aspects viz.
- Analysis of data which means methodical classification of financial statements and
- Interpretation of data which means explanation of meaning and significance of data. These two aspects are complementary to each other.
Objectives:
- To help in planning:An analysis of financial statements facilitates the business enterprises to understand its financial strength and soundness for future planning.
- To assist in estimating the earnings of business: Analysis of financial statements assist in knowing the earning is satisfactory or reasonable return on its investments is there or not. It also gives the idea of profitability of entire organisation and of every department.
- To assist in investment making decision: Investors are always eager to know liquidity of the business, ability of repayment of loan and its interest on borrowings which depends on the solvency and profitability of business organisation.
- To help management in assessing the efficiency of the organisation: Analysis of financial statements helps the business organisations to know the operational efficiency of its management. It also help to judge whether financial policies adopted by the management are appropriate or not.
- To provide financial information about economic resources: From the accounting data information and financial statements one can know the economic resources of the company.
- To provide information about changes in net resources arising out of business activities: From the financial statements one can know the net resources like payment of salary, wages, bonus and incomes sources.
- To disclose other information that is relevant to the need of the users of the financial statements: Financial statements also disclose other information which may useful to the government, employees, creditors, investors, etc.
Limitations : Analysis of financial statements depends upon the data and information provided by the
organisation.
(1) Qualitative information are ignored : The financial statements consider only the monetary aspects which can be measured. These statements ignores the qualitative, aspects such as development of team of loyal and efficient workers, harmony, reputation, prestige and efficiency of management competition, etc. There are some of the important matters which need to be considered for the business prospects.
(2) Historical cost: The information provided by the financial statements are historical in nature. This is because it considers and uses historical cost and book values of assets. It altogether fails to consider the changes that take place in price level.
(3) Based on ‘accounting concepts and conventions : Financial statements are prepared on the basis of certain accounting concepts and convention, so financial position as disclosed by these statements may not be realistic and their analysis cannot be much useful in practical life.
(4) Influenced by personal judgement : In the analysis of financial statement, many items are left for the personal judgement of an accountant. For instance, selection of method of depreciation, inventory valuation, writing off deffered revenue expenditure, etc. The soundness and reliability of such judgement depend on the competence, experience, ability and honesty of an accountant. However, convention of consistency acts as a controlling factor on making indiscreet personal decisions.
(5) Being uncomparable: Differences in date of preparation, nature of business, age of business, method of accounting, monopolistic market, etc. make the financial statement uncomparable.
(6) Static statement: Financial statements represents absolute figure which are static in nature and do not present the process by which the figures are arrived.
(7) Affected by window dressings : Sometimes management try to show excellent picture of business through financial statements which is not actually acceptable, e.g. To show excellent profit, sales figures may be taken at increased value, closing stock may be overvalued, last moment purchase not disclosed, etc. This is known as window dressing.
![]()
From the above discussion one can say that financial statements should not be taken as true indicator of financial strength and weakness of the business and do not take any serious decision based on it.
Analysis of Financial Statements :
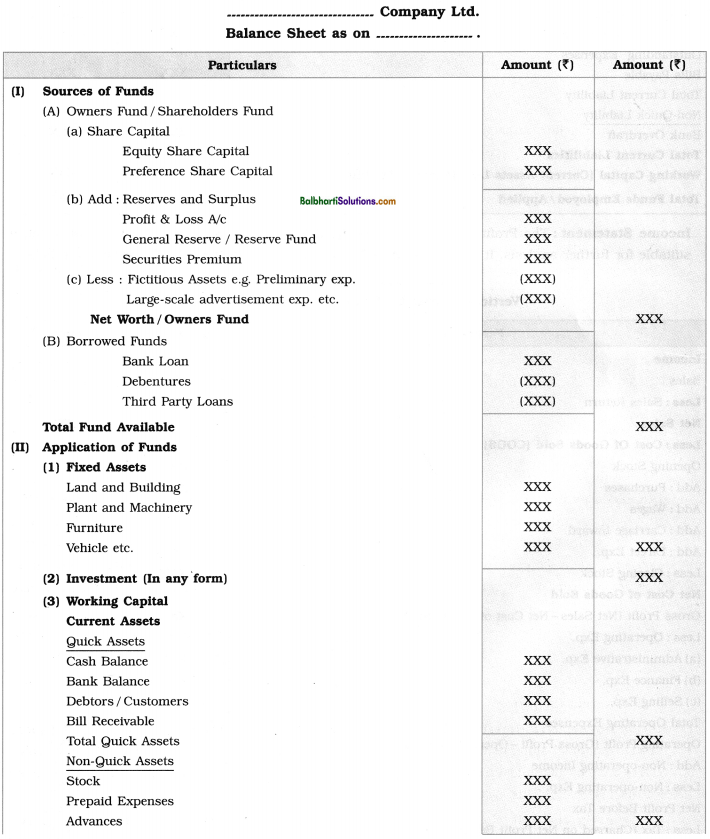
Balance Sheet: The Balance Sheet required to be arranged in vertical format which is suitable for further analysis. Its format is given below :
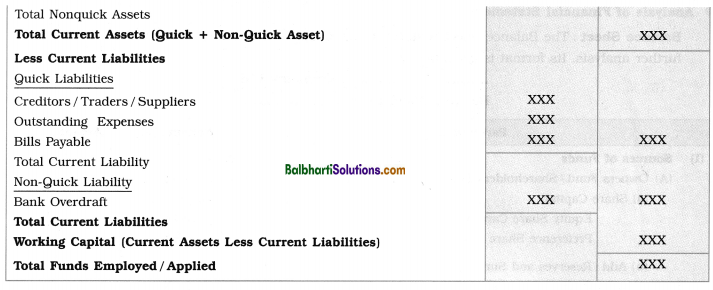
Income Statement: The Profit and Loss Account need to be arranged in a vertical format which is suitable for further analysis. It is also called as Vertical income statement. Its format is given below:
Tools for Financial Statement Analysis : The financial statements provide only figures of assets, liabilities, expenses, revenues, profit or loss of the business. For decision making only presentation and ascertainment of the figures are not sufficient. In order to make decision making easier and meaningful, analysis of financial statement is required. For analysis of financial statement various tools such as (i) Comparative Financial Statements, (ii) Common Size Statements, (iii) Cash Flow Analysis, (iv) Ratio Analysis are used.
(A) Comparative Financial Statements : The financial statements which contain the figures of two or more consecutive accounting periods to give comparative views of the financial performance and position of a business enterprise are called Comparative Financial Statements. In these statements, the figures for two or more successive years are placed side by side to facilitate comparison. Accordingly, horizontal or comparative analysis means a process of calculating in absolute figures or in percentage form, the changes from the comparative statements.
For this purpose following two statements are required : (1) Comparative Balance Sheet and
(2) Comparative Income Statement.
(1) Comparative Balance Sheet : The comparative Balance Sheet contains the figures of liabilities and assets of the current year and the previous years to facilitate easy comparison. Such comparative statements indicate the trend (increase or decrease) of the changes in the financial performance and position of the business enterprises.
![]()
Methods of preparing Comparative Balance Sheet:
Comparative Balance Sheet is prepared by comparing the individual items of Assets and Liabilities and finding out absolute and percentage increase or decrease in them.
Steps to prepare Comparative Balance Sheet:
- Enter the details of Assets and Liabilities in the first column.
- In the column number 2 and column number 3 enter the figures of previous year and current year Balance Sheet respectively.
- In column number 4 enter the absolute changes i.e. ‘Increase’ or ‘Decrease’ by comparing the figures of column 2 and column 3.
Absolute change = Current year – Previous year. - Record the percentage changes in fifth column.
Percentage change = \(\frac{\text { Absolute change }}{\text { Amount of previous year }}\) x 100
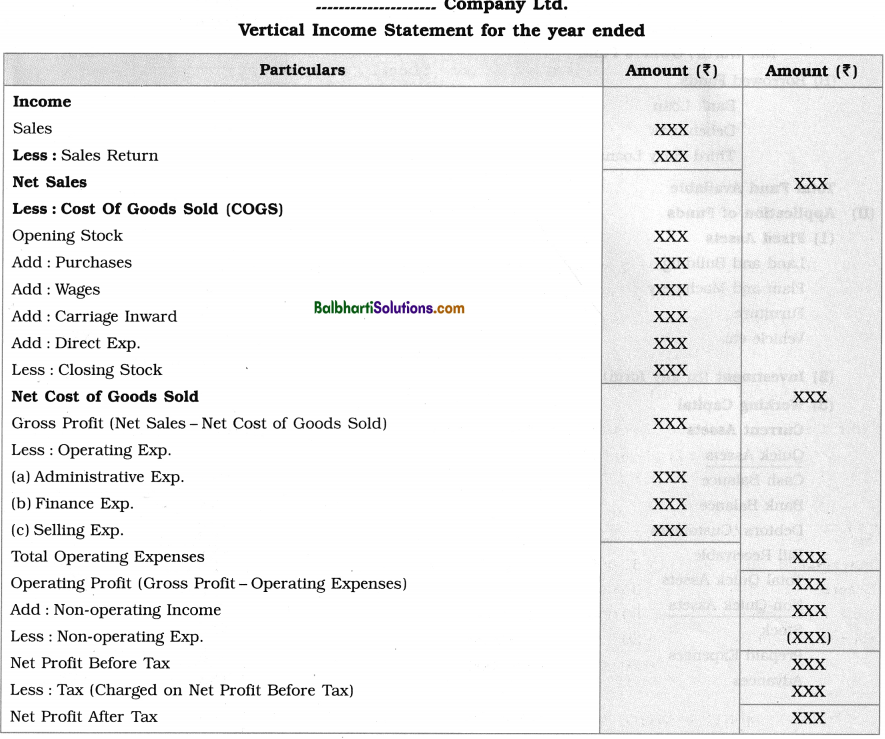
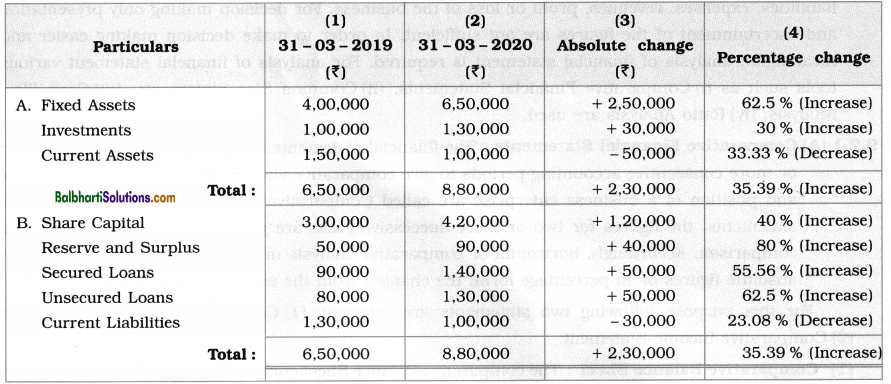
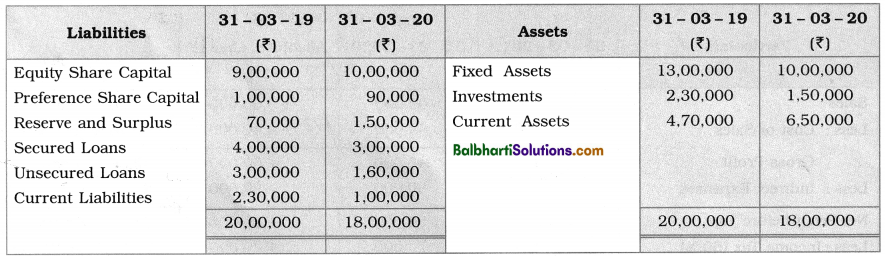
Example No. 1 : Balance Sheet of ‘X’ Ltd. Co. for the year ending 31st March, 2019 and 31st March, 2020 is given below:
You are required to prepare Comparative Balance Sheet of ‘X’ Ltd. Co. as on 31st March, 2019 and 31st March, 2020.
Solution:
Comparative Balance Sheet of ‘X’ Ltd. Co. as on 31st March, 2019 and 31st March, 2020.
2) Comparative Income Statement: A comparative income statement i.e. Profit and Loss Account contains the figures of expenses and incomes of the current year and the previous year for easy comparision.
Comparative income statement shows increase or decrease in various Trading and Profit and Loss Account.
Steps to prepare comparative income statement:
- Record the amount of Income and Expenditure in first column.
- Record the figures of previous year income statement in second column.
- Record the figures of current year income statement in third column.
- Record the absolute changes i.e. diffrence between current year and previous year in fourth column.
- Absolute change = Current year – Previous year.
- Record the percentage changes in fifth column.
Percentage change = \(\frac{\text { Absolute change }}{\text { Amount of previous year }} \times 100\)
Example No. 2: Income Statement of ‘X’ Ltd. Co. for the year ending 31st March, 2019 and 31st March, 2020 is given below:
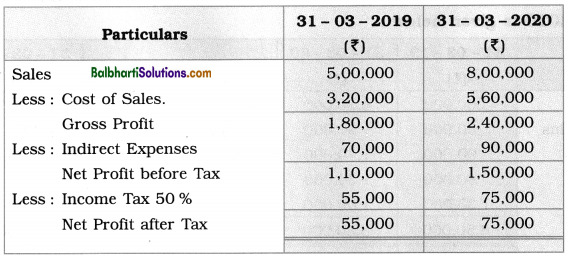
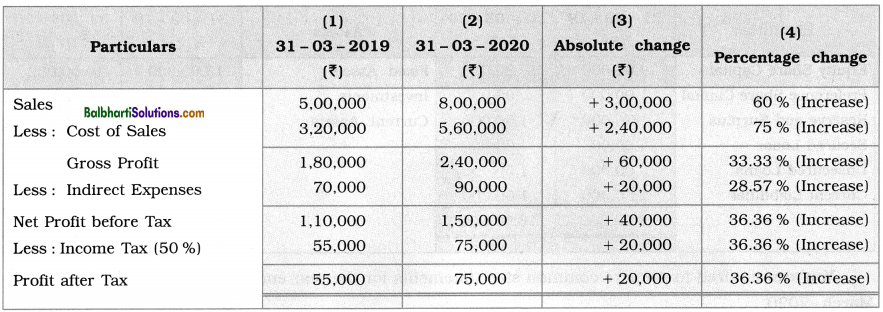
You are required to prepare Comparative Income Statement of X Ltd. Co. for the year ended 31st
March, 2019 and 31st March, 2020.
Solution:
Comparative Income Statement of ‘X’ Ltd. Co. for the year ended 31st March, 2019 and 31st March, 2020:
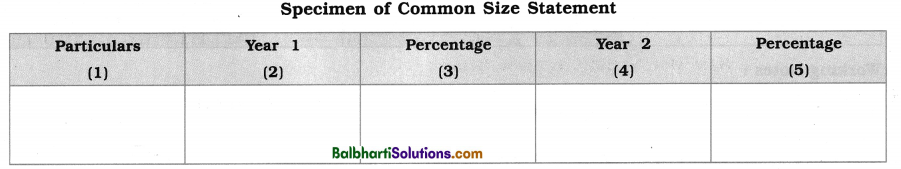
(B) Common Size Statement : Common Size Statement is a type of financial analysis in which the financial statements of the same period are compared and figures of each item are converted into percentage of some common figure or base. In this analysis, the income statement and position statement of two consecutive years of the same organisation or income and position statements of two similar units for the same period are used to draw useful conclusions.
For common size statement analysis, in Income statement usually the sales figure is taken as base, i.e. 100. All the other figures are converted into percentage form to sales. In position statement, the total assets and the total liabilities are taken as base, i.e. 100 each. All the figures on the respective sides are expressed in percentage to the total assets and the total liabilities respectively to draw meaningful conclusions.
![]()
Steps to prepare common size statements :
- Write absolute figures of each item of Balance Sheet or of Income Statement for two consecutive years.
- Select (choose) common base (as 100), e.g. in case of income statement sales figure as 100.
- Work out percentage of each item for two periods.
Example No. 3 : Balance Sheet of ‘Y’ Ltd. Co. for the year ending 31st March, 2019 and 31st March,
2020 is given below:
You are required to prepare common size statements for the year ending 31st March, 2019 and 31st March, 2020.
Solution :
Common size statements for the year ending 31st March, 2019 and 31st March, 2020
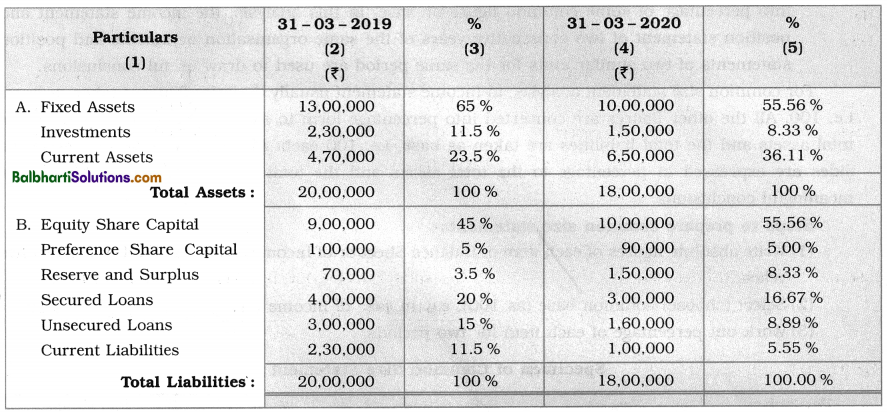
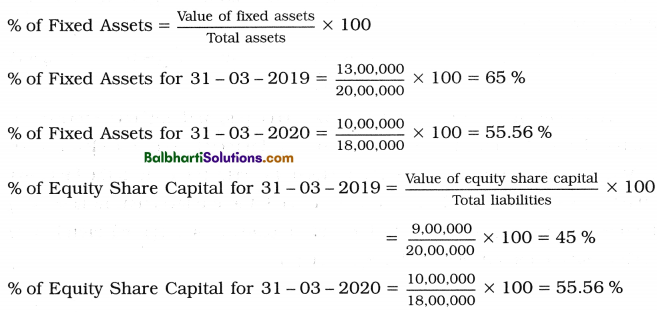
Working Notes :
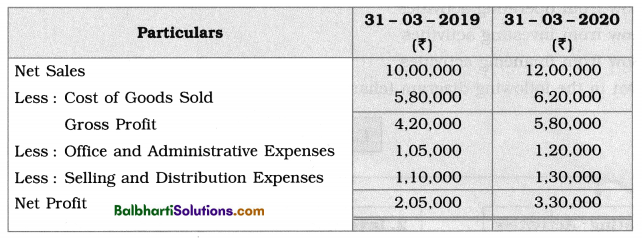
Example No. 4 :
Income statements for the year ending 31st March, 2019 and 31st March, 2020 are given below:
Solution:
Common Size Statement for the year ending 31st March, 2019 and 31st March, 2020:
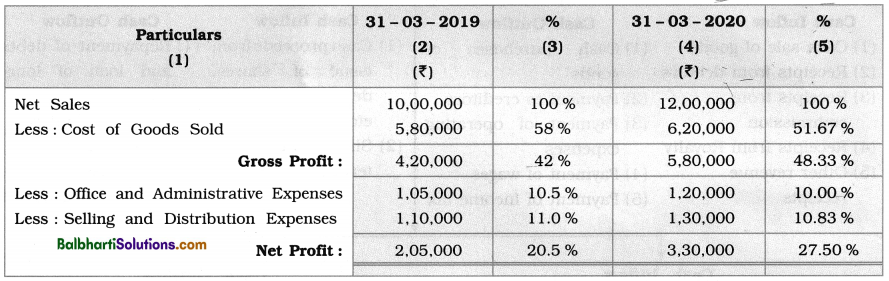
Working Notes :
Here base or aggregate is net sales. In the year ending 31 -03-2019 Net sales ? 10,00,000 is taken as base i.e. 100 % and in the ending 31 – 03 – 2020 Net sales ? 12,00,000 is taken as base i.e. 100 %.
For 31 – 03 – 2019 % of cost of goods sold = \(\frac{\text { Cost of goods sold }}{\text { Net sales }}\) x 100 = \(\frac{5,80,000}{10,00,000}\) x 100 = 58%
For 31 – 03 – 2020 % of cost of goods sold = \(\frac{6,20,000}{12,00,000}\) x 100 = 51.67 %
Benefits or advantages of common size statements :
(1) Common size statements are very useful for comparing the profitability. It gives the different trends in different items of Balance Sheet and Income statement.
(2) It is also useful for inter firm comparison i.e. comparison of income and position statements of two similar units in the organisation for the same period.
(C) Cash Flow Analysis : A statement which shows the inflows (receipts) and outflows (payments) of cash and cash equivalents of a business enterprise over a financial year, is called a cash flow statement. It indicates the different sources from which the cash comes into the business and the different uses to which the cash has been put. It helps the management in assessing the potential of the business enterprise in paying short-term loans. It is prepared month-wise to ascertain the cash available for various business purposes.
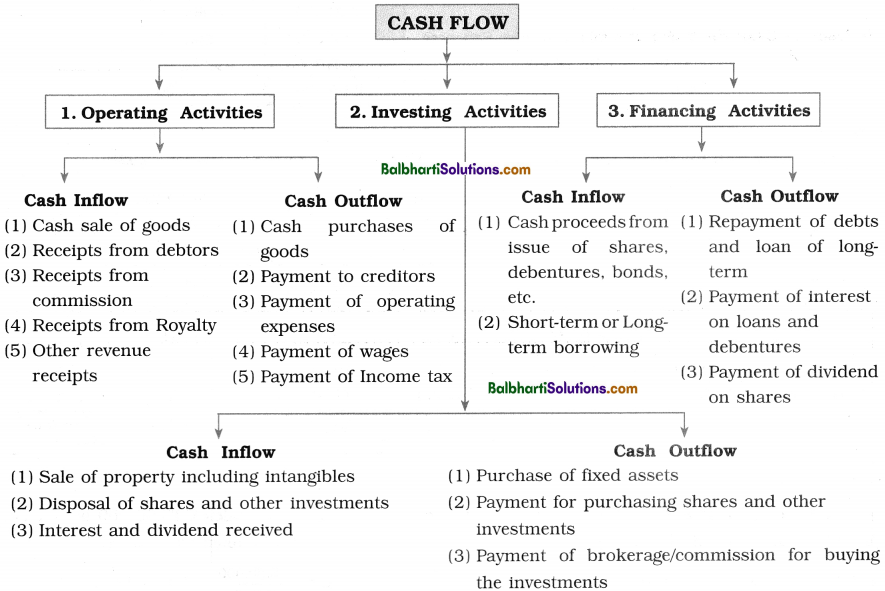
Steps to Prepare Cash Flow Statement : In Cash Flow Statenient its ‘inflow’ and outflow of Cash and Cash equivalents are grouped into:
- Cash flow from operating activities
- Cash flow from Investing activities
- Cash flow from financing activities
This is shown In the following diagram (chart):
![]()
Importance of cash flow statement:
- Useful in short-term financial planning and decision making: Cash flow statement provide information on uses of cash and cash equivalents for particular period. It is useful to prepare short-term financial planning and decision making on different areas.
- Helps in analysis of liquidity position : Cash flow statement may be prepared on monthly or quarterly basis. It helps to understand liquidity of the firm in better way. Such analysis of liquidity is useful to bank and financial institutions as it show ability of firm to repay Loans.
- Helps in efficient cash management: Cash flow statement provides information on surplus or defect of cash. If there is surplus, management makes arrangement for its investment and for deficit if any it arranges for short-term credit or loan.
- Helps in comparative study of cash flow statement and cash budget: Cash flow statement and cash budget are compared and cause of difference between them are analysed and necessary corrective measures are taken by the firm to generate or use cash.
- Helps in study of receipts and payments of cash : Cash flow statement gives information of the speed at which cash is collected from debtors, stock and other current assets and the speed at which current liabilities like creditors, Bank overdraft, etc. are paid off. This helps management to find true position of cash in future.
- Helpful in dividend declaration and payment of dividend : From cash flow statement, management ascertains the position of cash for payment of dividend.
- Tools of planning for projecting future investments and financial plans: Cash flow statement is useful to the management for projecting future investing and financial plans for the business.
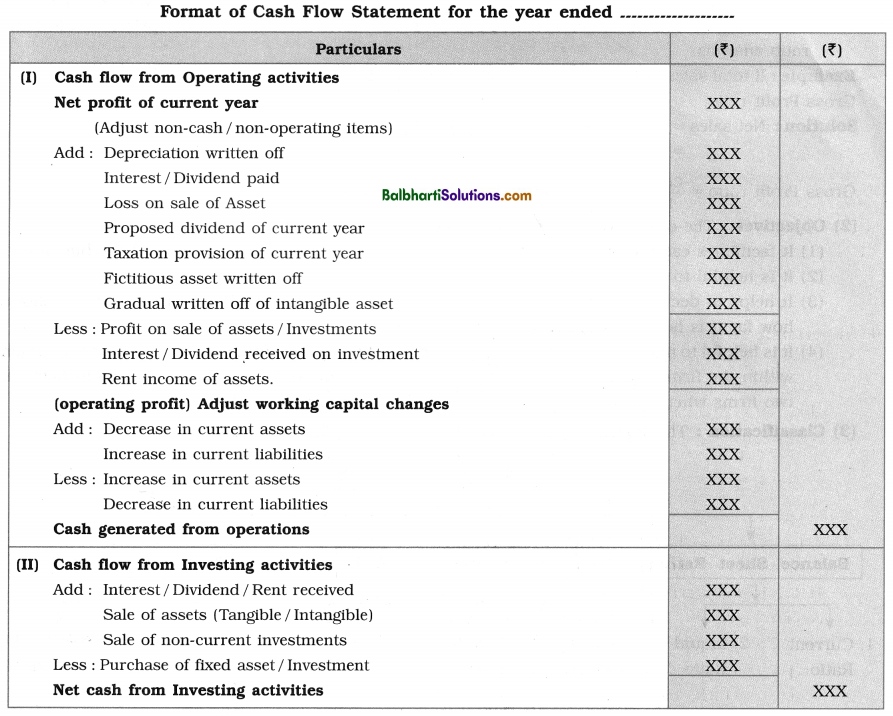
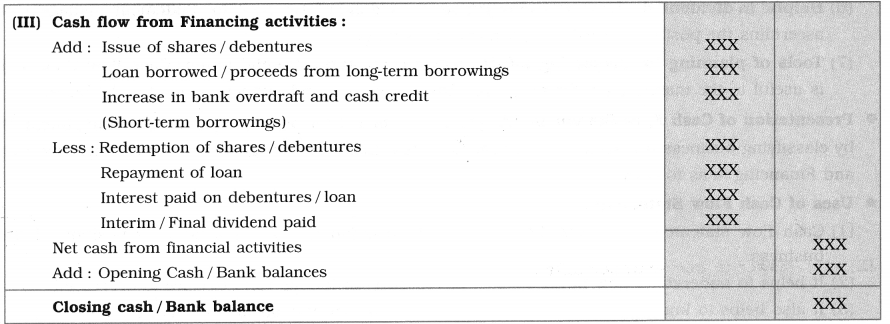
Presentation of Cash Flow Statement : As per AS – 3 format for presentation of cash from statement
by classifying business transactions of a specific period into three categories viz. Operating, Investing
and Financing is as follows :
Uses of Cash Flow Statement:
- Cash flow statement facilitates the business organisation to know the liquidity position of the business.
- It helps to understand how net profit has increased even though cash balance is decreased.
- It also helps to know how cash balance has increased even though firm incurred net loss.
- It facilitates the business firm to know how the requirements of working capital were met by the fund raised through current operations.
- It helps to know the external sources of raising finance to meet needs of finance.
- It helps the firm to understand whether the firm sells its non-current assets or not.
Meaning, Objectives and Classification of Accounting Ratios-
(1) Meaning : A relationship between two numbers or quantities, when expressed either in number, fraction, proportion or in percentage is called ratio. Accounting ratio expresses the relationship between two accounting figures and measures the ability i.e. financial strength of the business enterprise to pay its liabilities and judge its earning capacity. The use of different types of accounting ratios to evaluate the financial performance of the business enterprise, is called the ratio analysis.
Example : If total sales is ₹ 5,15,500, Sales returns is ₹ 5,500 and Gross profit is ₹ 1,27,500, calculate
Gross Profit ratio.
Solution :
Net sales = Total sales – Sales returns
= 5,15,500-5,500 = ₹ 5,10,000
Gross Profit ratio = \(\frac{\text { Cross profit }}{\text { Net sales }}\) x 100 = \(\frac{1,27,500}{5,10,000}\) x 100 = 25 %
Net sales 5,10,000
(2) Objectives : The objectives of ratios are explained as follows :
- It facilitates easy comparative analysis of profitability, liquidity and solvency of the business.
- It is helpful to know the changes that take place in the business.
- It helps in decision making in vital areas such as operating, investing and financing. It shows how far it is helpful to improve the performance.
- It is helpful to make different types of comparisons like (i) Intra firm comparison i.e. comparison within the firm over number of years and (ii) Inter firm comparison i.e. comparison between two firms when specific standard for the firms or industry is established.
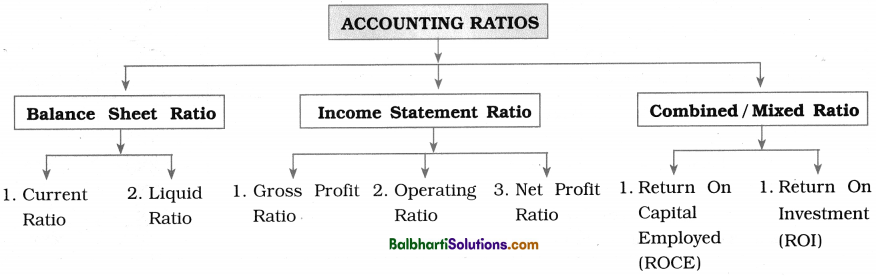
(3) Classification : The classification of ratio is shown in the following chart :
Introduction to Ratios-
(1) Current Ratio : The ratio of current assets to the current liabilities is called Current ratio. This ratio measures the ability of the business enterprise to fulfil the current obligations. It is one of the indicators which judges the financial position of a business enterprise. The current ratio between 2 : 1 to 3 : 1 is considered more satisfactory or ideal. The ratio of 2: 1 indicates that the current assets are twice the current liabilities. The formula for calculating the current ratio is given below:
Current ratio = \(\frac{\text { Current assets }}{\text { Current liabilitles }}\)
(Where the current assets include cash and bank balance, loose tools, bills receivable, sundry debtors, stock of inventories, i.e. raw-materials, semi-finished and finished goods, prepaid expenses, marketable securities, short-term loans and advances given, incomes accrued, disposable investments, etc.
The current liabilities include sundry creditors, bills payable, bank overdraft, dividend and taxes payable, outstanding expenses, debentures payable within a year, short-term loan taken, provision for taxation, proposed and unclaimed dividend, income pre-received i.e. income received in advance, etc.)
(2) Liquid Ratio (Quick Ratio or Acid Test Ratio) : The ratio of quick assets to current libilities is called Quick ratio or Acid test ratio. The assets which can be converted into cash immediately, or at a short notice are called Quick assets. All current assets except stock and prepaid expenses are considered as quick assets. Quick ratio of 1 : 1 is considered as an ideal ratio. It measures the liquidity position of business enterprise.
![]()
The formula for calculating liquid ratio is given below :
Liquid or Acid test ratio = \(\frac{\text { Quick assets }}{\text { Current liabilities }}\)
(Where Liquid or Quick assets = Cash + Bankbalance + Debtors + Bills receivable + Marketable securities)
Quick Ratio = \(\frac{\text { Quick assets }}{\text { Quick liabilities }}\)
(Where Quick liabilities = Current liabilities Less Bank overdraft, Advance received and Cash credit.) .
(3) Gross Profit (Turnover) Ratio : Gross profit ratio indicates the relation of the gross profit to the net sales. It is expressed in the percentage form. It is calculated to measure the efficiency of the production department. It is calculated by using the following formula :
Gross Profit ratio = \(\frac{\text { Gross profit }}{\text { Net sales }}\) x 100
[Where
- Gross profit = Net sales – Cost of the goods sold.
- Net sales = Total sales – Sales returns.
- Cost of Goods sold = Opening stock + Purchases + Direct expense – Closing stock]
It shows the gross margin on commodity sold. Higher gross profit ratio shows good position of business.
(4) Operating Profit Ratio : Operating profit ratio measures the relationship between operating profit and net sales.
Operating Profit ratio = \(\frac{\text { Operating Profit }}{\text { Net Sales }}\) x 100
Where Operating Profit = Gross Profit – Operating Expenses.
Net sales = Sales – Return – Allowances
Expenses may be categorised into two parts viz. (i) Operating expenses and (ii) Non-operating expenses.
Operating Expenses: Expenses which are incurred by the business enterprises for routine operation of the business are called operating expenses. They include office expenses, administrative expenses, selling and distribution expenses, etc. When such expenses are deducted from gross profit, we get operating profit.
Non-operating Expenses : Non-operating expenses include depreciation charged on fixed assets, loss incurred on sale of fixed asset or investment, loss by fire, goodwill written off, discount on issue of shares and debentures, preliminary expenses, etc. ‘
(5) Net Profit Ratio : The net profit ratio shows the relationship between the net profit and the net sales. It is expressed in percentage form. This ratio is helpful to measure the over-all efficiency of the business enterprise. The formula to calculate the net profit ratio is given below:
- Net Profit Ratio = \(\frac{\text { Net profit }}{\text { Net sales }}\) x 100
- Net Profit Ratio = \(\frac{\text { Net Profit Before Tax }}{\text { Net sales }}\) x 100
- Net Profit Ratio = \(\frac{\text { Net Profit After Tax }}{\text { Net sales }}\) x 100
(Where Net profit = Gross profit + Non-operating incomes – Operating expenses – Non-operating expenses.)
Non-operating income includes income from non-trading activities, e.g. interest received, dividend received, any compensation received, refund of tax, profit on sale of fixed assets and investments. For calculating this ratio, Net profit may be taken either before tax paid or net profit after tax paid. The main aim of this ratio is to understand return on investment.
Operating Ratio: The ratio which expresses the relationship between total operating costs and net sales is called operating ratio. This ratio is expressed in percentage form.
Operating Ratio = \(\frac{\text { Cost of Goods Sold + Operating Expenses }}{\text { Net sales }}\) x 100
Where Cost of goods sold = Opening stock + Purchases + Wages – Closing stock
Operating Expenses = Office and Administrative expenses + Selling and distribution
expenses + Finance expenses (excluding interest on Loans and debentures)
Net sales = Sales-Returns-Allowances.
(6) Return On Investment (ROI) : This ratio indicates the relationship between the profit before interest and tax and total investment of the business enterprise. This ratio is computed to measure the over-all efficiency or profitability of the business enterprise. This ratio is computed by using the following formula :
Return On Investment ratio= \(\frac{\text { Profit before interest, tax and dividend }}{\text { Capital employed }} \times 100\)
Where Capital investment or Capital employed = Equity share capital + Preference share capital + Reserve and Surplus + Debenture capital + Other-long term loan. OR We can use the following formula to calculate capital employed
Capital employed = Fixed assets + Current assets – Current liabilities.
This ratio indicates the ability of the company to generate the profit per rupee of capital employed.
![]()
(7) Return On Capital Employed (ROCE) i This ratio indicates the relationship between Net profit before interest and tax and Net capital employed by the proprietor. In case of the company net capital employed refers to shareholders’ capital, i.e. the funds supplied by equity shareholders and Preference shareholders. It is computed by using the following formula :
Return On Capital Employed = \(\frac{\text Net profit before interest and tax }{ Net capital employed or equity }}\)
Net Capital Employed = Total assets – Current liabilities
= Fixed assets + Current assets – Current liabilities.
This ratio indicates whether shareholders’ fund is efficiently used or not. As far as possible Return On Capital Employed ratio should be higher than Return On Investment ratio.