Std 12 Economics Chapter 8 Question Answer Public Finance in India Maharashtra Board
Balbharti Maharashtra State Board Class 12 Economics Solutions Chapter 8 Public Finance in India Textbook Exercise Questions and Answers.
Class 12 Economics Chapter 8 Public Finance in India Question Answer Maharashtra Board
Economics Class 12 Chapter 8 Question Answer Maharashtra Board
1. Choose the correct option
Question 1.
Optional functions of Government:
a) Protection from external attack
b) Provision of education and health services
c) Provision of social security measures
d) Collection of tax
Options:
1) b and c
2) a, b and c
3) b, c and d
4) All of the above
Answer:
1) b and c
![]()
Question 2.
Obligatory functions of the Government:
a) Provision of employment
b) Maintaining internal law and order
c) Welfare measures
d) Exporting goods and services
Options:
1) c and d
2) a and b
3) only b
4) a, c and d
Answer:
3) only b
Question 3.
Public finance is one of those subjects which are on the borderline between economics and politics’ ……………. is the view of
a) Adam Smith
b) Alfred Marshall
e) Prof. Hugh Dalton
d) Prof. Findlay Shirras
Options:
1) only a
2) only b
3) only c
4) only d
Answer:
3) only c
Question 4.
Non-tax sources of revenue:
a) Direct and Indirect Tax
b) Direct Tax and Fees
c) Fees
d) Special Levy
Options:
1) b and c
2) a and c
3) a, b, c andd
4) c and d
Answer:
4) c and d
Question 5.
Trends shown by Public expenditure of any Government shows following trend.
a) Constant
b) Increasing
c) Decreasing
d) Fluctuating
Options:
1) only a
2) only b
3) only c
4) only d
Answer:
2) only b
![]()
Question 6.
Identify the right group of pairs from the given options.
I) Direct tax – a) Non-tax revenue
ii) Indirect tax – b) Inflation
iii) Fees and Fines – c) GST
iv) Surplus budget – d) Personal income tax
Options:
a) i-d ii-c iii-b iv-a
b) i-c li-d ill-a iv-b
c) i-d li-c ill-a iv-b
d) i-a li-b iii-c iv-d
Answer:
c) i-d li-c ill-a iv-b
2. Distingwish between following concepts:
Question 1.
Public finance and Private finance.
Answer:
| Public Finance | Private Finance |
| (a) Public finance refers to income and expenditure of public authorities. | (a) Private finance refers to income and expenditure of individual and private sector organisations. |
| (b) The objective of public finance is to offer maximum social advantage. | (b) The objective of private finance is to fulfil private interest. |
| (c) Credit availability is more to increase public finance. | (c) Credit availability is limited to increase private finance. |
| (d) The supply of public finance is more elastic. | (d) The supply of private finance is less elastic. |
| (e) In case of public finance, government first determines the volume and different ways of it’s expenditure. | (e) In case of private finance, an individual considers income first and then determines the volume of expenditure. |
Question 2.
Internal debt and External debt.
Answer:
| Internal Debt | External Debt |
| (a) It refers to borrowings of the government to raise fund within the economy. | (a) It refers to borrowings of the government to raise fund outside the economy. |
| (b) In case of internal debt, domestic currency is used. | (b) In case of external debt, foreign currency is used. |
| (c) It is less complex to manage internal debt. | (c) It is more complex to manage external debt. |
| (d) E.g. borrowings from RBI, nationalized banks and business organisations within a country. | (d) E.g. borrowings from foreign government and international organisation like IMF, World Bank, etc. |
![]()
Question 3.
Developmental expenditure and Non developmental expenditure.
Answer:
| Developmental Expenditure | Non-developmental Expenditure |
| (a) The government expenditure which gives productive impact is called developmental expenditure. | (a) The government expenditure which does not yield any direct productive impact, is called non-developmental expenditure. |
| (b) Developmental expenditure results in the generation of employment, an increase in production, etc. | (b) Non-developmental expenditure does not help to increase employment or production level. |
| (c) Expenditure on education, industrial developmental expenditure. | (c) Administration cost, war expenses, etc. are examples of non-developmental expenditure. |
| (d) They are productive in nature. | (d) They are unproductive in nature. |
Question 4.
Special assessment and Special levy.
Answer:
| Special Assessment | Special Levy |
| (a) The charges paid by the citizens for getting certain special facilities by authorities are called special assessment. | (a) Special Levy are the charges levied on those commodities, whose consumption is harmful to human health. |
| (b) The objective behind taking special assessment is to provide extra special facilities to people. | (b) The objective behind charging special levy is to discourage the consumption of harmful commodities. |
| (c) Special assessment is taken from residents of a particular area. | (c) Special levy is taken from consumers of particular commodities. |
| (d) E.g. Special assessment is paid for the provision of special facilities like roads, water supply, etc. | (d) Special levy is paid for using commodities like wine, opium and other intoxicants, etc. |
Question 5.
Direct Tax and Indirect tax.
Answer:
| Direct Tax | Indirect Tax |
| (a) It refers to that tax which is paid by a person on whom it is legally imposed. | (a) It refers to that tax which is imposed on one person but paid by the other. |
| (b) A direct tax is paid by a person on whom it is legally imposed. It cannot be transferred. | (b) Indirect tax is imposed on one person but paid by the other. |
| (e) In case of public finance, government first determines the volume and different ways of it’s expenditure. | (e) In case of private finance, an individual considers income first and then determines the volume of expenditure. |
3. State with reasons whether you agree or disagree with the following statement:
Question 1.
Obligatory function is the only function of the Govenment.
Answer:
No, I do not agree with this statement.
It is essential to perform obligatory functions for the government like protection from external attack, maintaining law and order, defence and civil administration, etc.
But modern government also perform some optional functions also. They are necessary for social and economic development of the country such as provision of education and health services, provision of social security like pensions and other welfare measures.
So, government has to perform obligatory as well as optional functions.
![]()
Question 2.
Fines and penalties are a major source of revenue for the Government.
Answer:
No, I do not agree with this statement.
Public revenue is the aggregate income, with the government, comes through various sources.
These sources are classified as tax-revenue and non-tax revenue.
Tax revenue is a compulsory contribution from people to government without getting any special benefits to tax-payers.
So, tax revenue is the major source of revenue for the government.
However, fines and penalties are sources of non-tax revenue.
The government imposes fines and penalties { only on those who violate the laws of a country. So, the income from this source is ) very small.
Question 3.
The goods and services tax (GST) has replaced almost all indirect taxes in India.
Answer:
Yes, I agree with this statement.
The Goods and Service Tax (GST) came into effect in India on 1st July, 2017.
GST is an indirect tax used in India, on the supply of goods and services.
GST simplified the tax system in a country.
GST is different from an excise or sales tax imposed on the manufacture or sale of ; a product. GST is a tax levied on supply of goods and services.
GST replaced almost all indirect taxes like central excise duty, service tax, entry tax, entertainment tax, etc.
Because, GST is a comprehensive tax base with nationwide coverage of goods and ; services.
Question 4.
Democratic Governments do not lead to increase in public expenditure.
Answer:
No, I do not agree with this statement. i Public expenditure is that expenditure which is incurred by the public authority (i.e., central, state and local government). Public expenditure is required for protection of the citizens, for satisfying their collective needs and for promoting economic and social welfare of the people.
In a democratic state, government has to ( perform the obligatory functions like, defence and civil administration, maintaining internal law and order, etc.
Government also performs optional functions like provision of education and health services, provision of social security, etc.
To perform all these functions more efficiently, democratic government leads to increase in public expenditure.
![]()
Question 5.
Public finance is more elastic than private finance.
Answer:
Yes, I agree with this statement.
Public finance refers to the income and expenditure of public authorities, whereas, private finance is the income and expenditure of individuals and private sector organisations.
The main objective of public finance is to offer maximum social advantage, while the main motive of private finance is to fulfil private interest.
Public finance is more elastic compare to private finance because credit provision is much more in the market to increase public finance but, credit availability is limited to increase private finance.
It is also possible to the government to adjust revenue and expenditure with one another in case of public finance.
4. Read the given passage and answer the questions:
‘The conventional notion of social security is that the government would make periodic payments to look after people in their old age, ill-health. disability and poverty. This idea should itself change from writing a cheque for the beneficiary to institutional arrangements to care for beneficiaries. including by enabling them to look after themselves. to a large extent.
The write-a-cheque model of social security is a legacy from the rich world at the optimal phase of its demographic transition, when the working population was numerals enough and earning enough to generate the taxes to pay for the care of those not working. This model is ill-suited for less, well- off India with growing life expectancy. increasing urbanization and resultant migration. Social security
under urbanization will be different from social security in a static society.
Question 1.
State the conventional notion of social security.
Answer:
The conventional notion of social security is that the government would make periodic payments to look after people in their old age, ill-health, disability and poverty.
Question 2.
What kind of conceptual change is suggested in the given paragraph.
Answer:
The given paragraph suggests that, the idea should change from writing a cheque for the beneficiary to institutional arrangement to care for beneficiaries.
It will enable them to look after themselves to a large extent.
Question 3.
What is a legacy of social security from the rich world?
Answer:
The write-a-cheque model of social security i is a legacy from the rich world.
![]()
Question 4.
Which features of India make the traditional model of social security ill-suited for the
economy?
Answer:
Growing life expectancy, increasing urbanization and resultant migration are the features of India that make the traditional model of social security ill suited for the economy.
5. Answer the following:
Question 1.
State the types and importance of Government budget.
Answer:
(B) Importance of Budget:
Budget is important in number of ways.
(1) Tax rates presented in the budget indicates disposable income of the tax payer. It also determines the development of business and individuals.
(2) Government expenditure is also a part of budget. This public expenditure on defence, administration, infrastructure, education, health care, etc. affects the lives of the citizens and overall economy.
(3) Government uses budget as a medium for implementing economy policies in the country.
(4) Budgetary actions of the government affect production size and distribution of income, utilization of human and material resources of the country.
Thus, implementing suitable budgetary policy is very important for overall development of the economy.
Question 2.
Explain the principles of taxation.
Answer:
Principles of taxation are also called canons of taxation. There are four principles (canons) of taxation, propounded by Adam Smith
(1) Canon of Equity or Equality
(2) Canon of Certainty
(3) Canon of Convenience
(4) Canon of Economy
They are explained as follows :
1. Canon of Equity or Equality : According to Adam Smith, every person should pay taxes to the government in proportion to his ability to pay.
Canon of equity or equality means rich people should pay more tax as compared to poor.
2. Canon of Certainty : Adam Smith suggested that the tax payer should know in advance that, how much tax he has to pay, at what time and in what form he has to pay tax to the government.
3. Canon of Convenience : According to this principle, every tax should be levied in such a manner and at such a time that, it becomes convenient to the tax payer to make payment.
![]()
4. Canon of Economy : This principle suggests that the cost of tax collection should be the minimum. If tax is collected economically, then such a tax is considered to be a good tax.
Every citizen of a country has to pay tax, imposed upon him as it is compulsory contribution to the government.
Tax is a major source of revenue to the government.
Therefore, public authority (Government) must consider all the principles (canons) of taxation in the preparation and implementation of tax system.
Question 3.
Explain non-tax sources of revenue of the Government.
Answer:
Non-tax revenue refers to the revenue received by the government from various ? sources other than taxes.
The sources of non-tax revenue are as follows:
Fees : It refers to charges paid, in return for certain specific services rendered by the government. E.g. fees paid for registration of house, car, education fees, etc.
Prices of Public Goods and Services : Various types of goods and services are produced, supplied and sold by modern government to the citizens. It; is added to public revenue when people s purchase them and pay their prices.
Special Assessment : It is special kind of tax, which is levied by local government on the residents of a particular area. In exchange of it, government provides some special facilities to them.
Fines and Penalties : It is imposed by government on those who violate the laws of the country.
E.g. a traffic police charges fine and collects money if someone violates traffic rule. The objective behind collection of fines and penalties is not to earn money but to discourage the people from violating the laws framed by the government It is small source of income.
Gifts, Grants and Donations : The government receives gifts from its citizens and others. It is included in public revenue. The government may also get grants from foreign government and institutions for general and specific purposes.
Foreign aid is also an important form of public revenue for developing country like India. However, this source of revenue is uncertain in nature.
Special Levies : It refers to the charges levied by government on those commodities, whose consumption is harmful to human health.
Special levies are paid for using commodities like wine, opium and other intoxicants. Special levy is imposed, not to earn income, but to discourage the people from using harmful products.
Borrowings: Government borrows to raise fund because government expenditure generally exceeds government revenue, in a welfare state.
When government borrows from foreign government or international organisations, it is known as external debt. It is more popular source of public revenue for investment in development of projects. Thus, public revenue in form of non-tax sources play very important role in socio¬economic development of a country. Explain the classification of public expenditure.
6. Answer in detail :
Question 1.
Explain various reasons for the growth of public
expenditure.
Answer:
Public expense is the expense incurred by the government (central, state and) local government). It is necessary for the protection of the citizens, for satisfying collective needs of the society and for ? promoting economy.and social welfare of a S country.
Public expense is necessary to perform various functions of the government Public ; expense consists of revenue and capital expenses as well as developmental and non-developmental expenses.
1. High Growth of Population : In a developing country like India, population is rising rapidly. Therefore, government has to incur greater expense to fulfil the needs of growing population.
(2) Growing Urbanisation : Due to expansion of urban sector, government expense increases. Government has to make the provision of water supply, roads, energy, schools and colleges, public transport, hospitals, welfare centres, sanitation, drainage system, etc.
It leads to growth in public expense.
(3) Public Health Care : Public health is a top most priority of modern welfare state. Government undertakes public vaccination programme, maintenance of dispensaries, maternity care and child welfare centres, etc
.
(4) Democracy : There is a democracy in India. A democratic form of government is very expensive due to regular elections and other public works.
It leads to growth in public expense.
(5) An increase in Defence Expense : Government has to incur defence expense to protect the country from external attacks as well as to maintain law and order in a country. Hence, an increase in defence expense leads to growth of public expense.
(6) Disaster Management : Many natural calamities like earthquakes, flood, cyclones, Covid-19 and man-made problems like social unrest, economic instability, etc. occur frequently. In such cases, government has to spend for disaster management which increases public expense.
(7) Infrastructure Development : It is necessary to make provision of economic infrastructure like energy, transport, communication and social infrastructure like education, health, etc. for rapid economic development of a country.
Thus, development of infrastructure facilities results into growth of public expense.
(8) Inflation : Due to inflation, prices of goods and services tend to rise. When government buys goods and services from the market for development of a country, government has to pay higher cost which raises public expense.
(9) Industrial Development : An increase in production depends upon industrial development. It leads to an increase in level of employment and overall economy growth. So, government implements various schemes and programmes for industrial development.
It results into growth of public expense.
(10) Increase in Government Activities : The modern government performs various obligatory and optional functions for social and economic development of a country. It requires huge fund to spend on education, public health, public recreation, social welfare schemes, etc.
Many other functions like maintenance of roads, lighting, public streets, construction of public houses, protecting life and property, public vaccination, garbage collection and ; disposal, prevention and control of epidemics etc. lead to growth of public expenses.
Government also spends on provision of pure water supply, removal of slums, checking ) food adulteration, etc.
All these factors are responsible for the j growth of public expense.
![]()
Intext Questions
Find out (Textbook Page 70) :
More examples of obligatory and optional functions of the government.
Answer:
| Obligatory Functions of Govt. | Optional Functions of Govt. |
| (a) Supply and maintenance of water works. | (a) Construction of public parks and gardens. |
| (b) Extinguishing fires and protecting life and property when fire occurs. | (b) Town planning |
| (c) Prevention and control of epidemics (e.g. Corona) | (c) Housing for low income group |
| (d) Garbage collection and disposal | (d) Construction and maintenance of rest- houses |
| (e) Public vaccination | (e) Organising cultural events, sports etc. |
Find out (Textbook Page 73) :
Reasons for growth in public expenditure other than given in the text-book.
Answer:
- Rise in per capita income.
- Rural development.
- Provision of transport and communication.
- Reducing inequalities.
- Expenditure on social services (like food, housing, education etc.)
- Effects of war.
- Pressure of social progress.
![]()
Find out (Textbook Page 73) :
Important Social Welfare Schemes in India.
Answer:
| Name of the Scheme | Date of Launch | Main Objective |
| 1. Atal Pension Yojana | May 2015 | A contribution based program for poor people to receive pension. |
| 2. Deen Dayal Upadhyaya Grameen Kaushalya Yojana | Sept. 2014 | Providing gainful employment to rural Youth, through training. |
| 3. Pradhan Mantri Gramin Awaas Yojana | June 2015 | Providing financial assistance to rural poor for their houses. |
| 4. Integrated Child Development Services | Oct. 1975 | To tackle malnutrition and health problems in children below 6 years. |
| 5. Midday Meal Scheme | Aug. 1995 | Lunch (free of cost) to school children on all working days. |
| 6. Suraksha Bima Yojana | May 2015 | Accidental insurance with a premium of Rs. 12/- per year. |
| 7.Rashtriya Krishi Vikas Yojana | Aug. 2007 | Provision for development of agriculture and its allied sector |
Maharashtra State Board 12th Std Economics Textbook Solutions
- Introduction to Micro and Macro Economics Class 12 Economics Textbook Solutions
- Utility Analysis Class 12 Economics Textbook Solutions
- Demand Analysis Class 12 Economics Textbook Solutions
- Elasticity of Demand Class 12 Economics Textbook Solutions
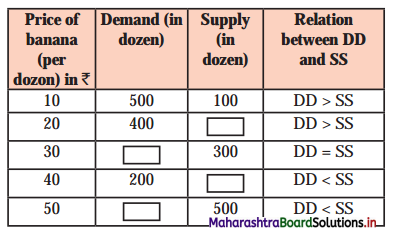
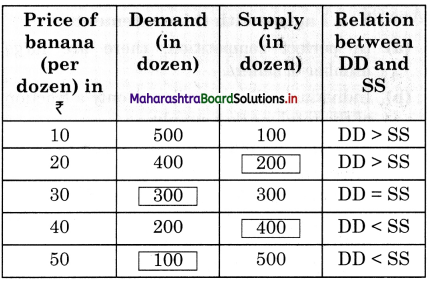
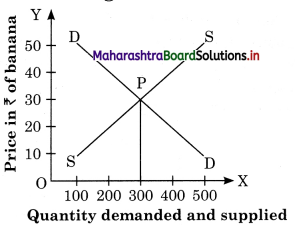
- Supply Analysis Class 12 Economics Textbook Solutions
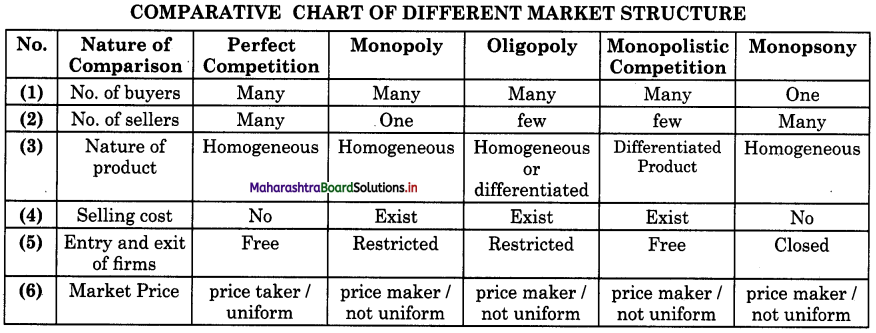
- Forms of Market Class 12 Economics Textbook Solutions
- Index Numbers Class 12 Economics Textbook Solutions
- National Income Class 12 Economics Textbook Solutions
- Public Finance in India Class 12 Economics Textbook Solutions
- Money Market and Capital Market in India Class 12 Economics Textbook Solutions
- Foreign Trade of India Class 12 Economics Textbook Solutions