Std 12 Economics Chapter 4 Question Answer Supply Analysis Maharashtra Board
Balbharti Maharashtra State Board Class 12 Economics Solutions Chapter 3B Elasticity of Demand Textbook Exercise Questions and Answers.
Class 12 Economics Chapter 4 Supply Analysis Question Answer Maharashtra Board
Economics Class 12 Chapter 4 Question Answer Maharashtra Board
1. Complete the following statements:
Question 1.
When supply curve is upward sloping, it’s slope is ……………….
a) positive
b) negative
c) first positive then negative
d) zero
Answer:
a) positive
Question 2.
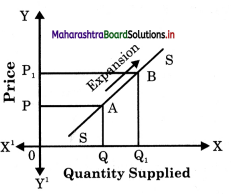
An upward movement along the same supply curve shows ………………..
a) contraction of supply
b) decrease in supply
c) expansion of supply
d) increase in supply
Answer:
c) expansion of supply
![]()
Question 3.
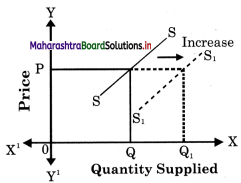
A rightward shift in supply curve shows ………………..
a) contraction of supply
b) decrease in supply
c) expansion of supply
d) increase in supply
Answer:
d) increase in supply
Question 4.
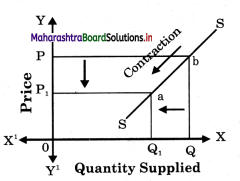
Other factors remaining constant, when less quantity is supplied only due to a fall in price, it shows ………………..
a) contraction of supply
b) decrease in supply
c) expansion of supply
d) increase in supply
Answer:
a) contraction of supply
Question 5.
Net addition made to the total revenue by selling an extra unit of a commodity is ………………..
a) total Revenue
b) marginal Revenue
c) average Revenue
d) marginal Cost
Answer:
b) marginal Revenue
2. Complete the Correlation:
1) Expansion of supply: Price rises:: Contraction of supply: ………………….
2) Total revenue : …………………. :: Average revenue :TR/TQ
3) Total cost : TFC + TVC :: Average cost : ………………….
4) Demand curve : …………………. :: Supply curve : Upward
5) …………………. : Change in supply :: Other factors constant: Variation of supply
Answers:
(1) Price falls
(2) PxQ
(3) TC ÷ TQ
(4) Downward
(5) Other factor changes
3. Give economic terms:
1) Cost incurred on fIxed factor.
2) Cost incurred per unit of output.
3) Net addition made to total cost of production.
4) Revenue per unit of output sold.
Answers:
(1) Fixed Cost
(2) Average Cost
(3) Marginal Cost
(4) Average Revenue
![]()
4. Distinguish between:
Question 1.
Stock and Supply.
Answer:
| Stock | Supply |
| (a) Stock refers to the total quantity of commodity available with producer for sale. | (a)Supply is that part of stock which the seller is willing to offer for sale at a given price. |
| (b) It is outcome of production. If production increases, stock will also increase. | (b) It is outcome of stock. Stock is the basis of supply. |
| (c) It is a fund or reservoir and a static concept (inelastic). | (c) It is a flow concept. It changes according to change in price (elastic). |
| (d) It can exceed supply. | (d) It cannot exceed stock. |
Question 2.
Expansion of Supply and Increase in Supply.
Answer:
Expansion / Extension of Supply
- When the supply of a commodity rises only due to the rise in the price of the commodity, then it is said to be extension in supply.
- Extension of supply is a case of variation in supply.
- Rise in price is the only factor due to which supply expands / extends.
- When there is extension in supply, there is an upward movement on the same supply curve.
Increase in Supply :
- The supply is said to increase if at the same price more is supplied.
- Increase in supply is a case of changes in supply.
- Supply increases due to
(1) fall in cost of production
(2) improvement in transport facility
(3) introduction of modern technology
(4) government subsidies
(5) more imports etc. - When there is an increase in supply, the supply curve shifts to the right of original supply curve.
Question 3.
Contraction of Supply and Decrease in Supply.
Answer:
Contraction of Supply
- Contraction of supply occurs when quantity supplied of a commodity falls due to a fall in price alone.
- It is a case of variation in supply.
- Supply contracts due to fall in price alone.
- When there is a downward n curve.
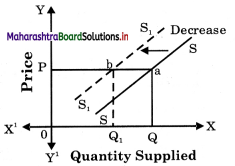
Decrease in Supply
- Decrease in supply occurs when less quantity is supplied at the same price.
- It is a case of changes in supply.
- Supply decreases due to –
(1) increase in cost of production
(2) transport strike
(3) outdated technique
(4) heavy taxes imposed by government.
(5) more exports etc. - When there is curve shifts to curve.
![]()
Question 4.
Average Revenue and Average Cost.
Answer:
| Average Revenue (AR) | Average Cost (AC) |
| (a) Average revenue refers to average income earned per unit of a sold commodity. | (a)Average cost refers per unit of cost of production of a commodity produced. |
| (b) It is calculated by dividing total revenue (TR) earned by number of unit sold. | (b) It is calculated by dividing total cost (TC)by number of units of that commodity produced. |
| (c) Symbolically it in expressed as \( [latex]\frac { Total Revenue }{ Total Quantity sold }\) [/latex] | (c) Symbolically it is expressed as \(\frac { Total Cost }{ Total Quantity produced }\) |
| E.g. If TR from sale of 10 units of a commodity is Rs. 1000 then, AP = 1000/10 = Rs. 100 | E.g. If TC of 100 units a commodity is Rs. 1000 then, AC = \(\frac { 1000 }{ 100 }\) = Rs. 10 |
5. Observe the following table and answer the questions.
A) Supply schedule of chocolates
| Price in Rs. | Quantity supplied in units |
| 10 | 200 |
| 15 | ……… |
| 20 | 300 |
| 25 | 350 |
| 30 | …….. |
| 35 | …….. |
| 40 | …….. |
Question 1.
Complete the above supply schedule.
Answer:
| Price in Rs. | Quantity supplied in units |
| 10 | 200 |
| 15 | 250 |
| 20 | 300 |
| 25 | 350 |
| 30 | 400 |
| 35 | 450 |
| 40 | 500 |
Question 2.
Draw a diagram for the above supply schedule.
Answer:
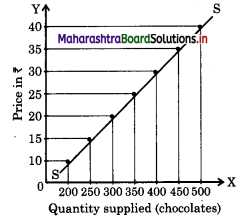
![]()
Question 3.
State the relationship between price and quantity supplied.
Answer:
This diagram shows the direct relationship / between price and quantity supplied of) chocolates. When its price is ? 10, 200 units ( are supplied and as price rises to 15, 20, 25 ? …. and so on, quantity supplied also rises to )
When the schedule is plotted on the graph we 250, 300, 350 and so on. This is the law of supply of an individual firm.
B) Observe the market supply schedule of potatoes and answer the following questions.
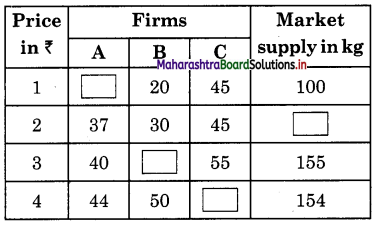
Question 1.
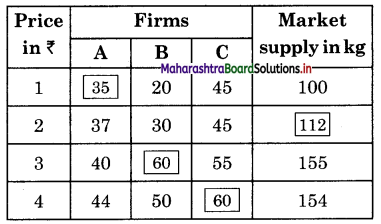
Complete the quantity of potato supplied by the firms to the market in the above table.
Answer:
Question 2.
Draw the market supply curve from the schedule and explain it.
Answer:
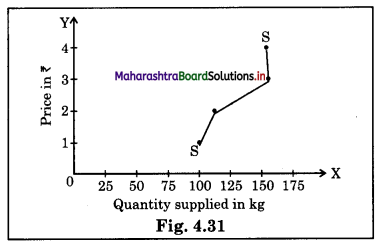
When the schedule is plotted on the graph we get a market supply curve ‘SS’ which is upward sloping. This curve shows that as price rises from ₹ 1 to ₹ 2, supply rises from 1oo to 112 kg, but when price rises from ₹ 2 to ₹ 3, supply rises to a greater extent from 112 kg to 155 kg in the market. When price rises to ₹ 4 Supply falls from 155 kg to 154 kg. This may be because of perishable or seasonal good that supply could not Jj be increased and supply falls. This show backward bending supply curve, showing partly an exception to the supply curve.
6. Answer the following questions:
Question 1.
Explain the concept of total cost and total revenue.
Answer:
Total Cost (TC): It is the total expenditure incurred by a fir m on the factors of production required for the production of goods and services. Total cost is the sum of Total Fixed Cost (TFC) and Total Variable Cost (TVC). Total Fixed Cost is the cost incurred on fixed factors of production like land, factory, building, capital, etc. These factors cannot be changed in the short period. They remain constant. Total Variable Cost is the cost incurred on variable factors such as raw – materials, labour, etc. These factors can be varied or changed according to the change in output level. So the variable cost varies. Total Cost = Total Fixed Cost + Total Variable Cost
i.e., TC = TFC + TVC
TC increases as the level of output increases.
Total Revenue :
(Income) refers to total receipts of the firm from its sales of commodity. It is obtained by multiplying the price per unit of the commodity with the total number of units!; of commodity sold to the consumers. Thus, Total Revenue = Price per unit Total Number of units of commodity sold.
Example : If the firm sells lo units of a commodity at ₹ 100 per unit then total revenuewifibe TR = 100 x 10. TR= ₹ 1000
![]()
Question 2.
Explain determinants of supply.
Answer:
- Cost of Production : Changes in the price of factors of production like rent, wages, interest affects the cost of production. When cost of production increases, supply decreases.
- Price of Other Goods : The supply of a given commodity depends on the price of other commodity. E.g. if the price of wheat rises and that of rice remains the constant, then the producer will think of producing J more of wheat. This will affect the supply of rice.
- price of the Commodity : Price is an important factor influencing the supply. More is supplied at a higher price and less at a lower price. So price and supply are 5 directly related.
- Climatic Conditions : The supply of j commodity is also influenced by the forces
- Government Policy : Government policies like taxation, subsidies, industrial policies etc., may encourage or discourage production and supply. A tax on the commodity will raise the cost of production and reduce the supply while a subsidy on the other hand will provide an incentive to increase production and supply.
- Exports and Imports : When the
government resort to imports, supply expands, at the same time heavy exports would reduce the supply in the domestic market. - Nature of Market : In a competitive market, the supply would be more but in a monopoly market the seller may create artificial scarcity to raise the price.
- Future Expectation : If future trends indicate a rise in price, the supply decreases at present. On the other hand if the sellers expect the future price to fall, supply would increase in the current period.
- Technique of Production : Improvement in the technique of production will lead to increase in supply. Application of advanced technology enables the producer to produce goods on large scale at a lower cost and lesser price.
- Infrastructure Facility : If means of transport and communication are well developed, the extent of market would be wide. i.e. supply will increase.
- Natural and Man-made Calamities : Natural calamities like earthquake, cyclone, flood etc., will affect the supply in the market. Even man-made calamities like a bomb-blast, affects supply. Even a strike call can affect supply in the market.
7. Answer in detail :
Question 1.
State and explain law of supply with exceptions.
Answer:
Law of Supply :
(A) Introduction : The law of supply was introduced by Dr. Alfred Marshall in his book “Principles of Economics” published in 1890. The law establishes a functional relationship between the price of a commodity and quantity supplied of that commodity. It explains the general tendency of the sellers in offering more goods for sale at a higher price than at a lower price.
(B) Statement of the Law : According to Prof. Alfred Marshall “Other things remaining constant, the higher the price of the commodity, greater is the quantity supplied and lower the price of the commodity, smaller is the quantity supplied.”In other words, quantity supplied of a commodity varies directly with price i.e., with a fall in price supply contract and with a rise in price supply expands.
S = f (P) [S = Supply, P = Price, f = Function of]
The law can be better understood with the help of a market supply schedule and market supply curve.
(C) Market Supply Schedule : Market supply schedule is a tabular representation of various quantities of a commodity offered for sale by all the sellers in the market at different prices during a given period of time. The schedule is a hypothetical one except one price rest are imaginary prices.
The above schedule clearly shows that sellers in general want to sell more at high prices and less at low price. E.g., at a low price of Rs.10 per unit the seller supplies only 100 units per day and at high price of Rs. 50 the supply rises to 500 units of ‘X’ per day.
![]()
(D) Market Supply Curve : It is graphical representation of the above market supply schedule. Price is measured on ‘Y’ axis and quantity supplied on ‘X’ axis and above schedule is plotted. We derive a supply curve SS.
Market Supply Schedule
| Price of ‘X’ per unit (in ?) | Total Market Supply per day (in units) |
| 10 | 100 |
| 20 | 200 |
| 30 | 300 |
| 40 | 400 |
| 50 | 500 |
There are some exceptions to the law of s supply. Following are such cases when supply may fall with the rises in price or rise with the fall in price.
(1) Labour supply : Supply of labour in the ) terms of hours of work is an important exception pointed out by economists. Generally when wages rise, workers work more, but after a certain point if wages continue to rise, supply of labour falls i.e. workers wish to earn more by work in for less hours and supply curve of labour would bend backwards as shown below :
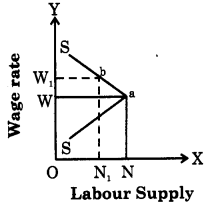
In this figure as wage rate rises up to 0W, ;i supply of labor also rises up to ON, but when wage rate rises to 0W., labour supply falls from ON to 0Nr Hence an exception.
(2) Saving : In case of savings generally it is observed that as the rate of interest rises, savings also rises but some people want to have a fixed regular income by way of interest. They may save less at a higher rate of interest and save more at a lower rate of interest. For example : suppose a person is interested in earning a fixed income of ₹ 800 p.a. then he saves ₹ 10,000/- at 8% rate of interest but when rate of interest increases to 10%, he will save only ₹ 8,000/-.
(3) Future Expectations: If the seller expects a fall in price in future, then he will supply more today even at a low price. But if he expects the prices to rise further in future he will withhold the supply today to supply more in future at a high price.
(4) Need for Cash : When the sellers are in urgent need of liquid cash, then even at a lower price they will offer more goods for sale.
(5) Rare Goods : In case of rare collections such as rare painting, old coins, antique, the law is not applicable as the supply remains fixed. The supply curve is a vertical straight line parallel to Y axis.
(6) Agricultural Goods: Supply of agricultural product is influenced by natural factors like climatic conditions, rainfall etc., which cannot be controlled by man. So in bad weather condition, even at a higher price the supply of agricultural commodities will not increase.
![]()
Intext Questions
Question 1.
“Concept of supply is a micro concept but concept of aggregate supply is a macro concept”. Explain. (Textbook Page No. 43)
Answer:
Micro economics studies about economic behavior of units like households, firm market and particular commodities. Whereas macro economics deals with the broad economic concepts like total demand, total supply, national income, etc.
Supply refers to supply of an individual seller and aggregate supply refers to total supply of a commodity.
Hence, supply is a microscopic concept and aggregate supply is macro concept.
Question 2.
What do you mean by aggregate supply? (Textbook Page No. 43)
Answer:
Aggregate supply refers to the minimum amount of sales proceeds which the entrepreneurs expect to receive from the sale of output at a given level of employment.
Find out (Textbook Page No. 43)
If a firm produces 600 units of a commodity in a day and incurs a total cost of ₹ 30,000. Calculate the Average Cost.
Answer:
Average cost refers to the cost of production per unit cost of a commodity. It is calculated by dividing total cost by total quantity of a commodity. Hence,
AC = \(\frac{\mathrm{TC}}{\mathrm{TQ}}=\frac{30,000}{600}\) = ₹ 50 per unit
![]()
Find out (Textbook Page No. 43)
If a firm sells 400 units of a commodity at ₹ 10 unit. Calculate the TR and AR.
Answer:
TR = Price X Quantity
= 10 x 400
= 4,000
AR = \(\frac{\mathrm{TR}}{\mathrm{TQ}}\)
= \(\frac{4,000}{400}\)
= ₹ 10
Maharashtra State Board 12th Std Economics Textbook Solutions
- Introduction to Micro and Macro Economics Class 12 Economics Textbook Solutions
- Utility Analysis Class 12 Economics Textbook Solutions
- Demand Analysis Class 12 Economics Textbook Solutions
- Elasticity of Demand Class 12 Economics Textbook Solutions
- Supply Analysis Class 12 Economics Textbook Solutions
- Forms of Market Class 12 Economics Textbook Solutions
- Index Numbers Class 12 Economics Textbook Solutions
- National Income Class 12 Economics Textbook Solutions
- Public Finance in India Class 12 Economics Textbook Solutions
- Money Market and Capital Market in India Class 12 Economics Textbook Solutions
- Foreign Trade of India Class 12 Economics Textbook Solutions