By going through these Maharashtra State Board Class 12 Economics Notes Chapter 3A Demand Analysis students can recall all the concepts quickly.
Maharashtra State Board Class 12 Economics Notes Chapter 3A Demand Analysis
Meaning of Demand:
Demand refers to a desire or want for goods. Desire is the willingness to have some commodity which is backed by willingness and ability to pay.
Definition:
According to Benham, “The demand for anything at a given price is the amount of it, which will be bought per unit of time at that price. ”
Features of Demand:
- Demand is a relative concept.
- Demand is always expressed with reference to time and price.
Demand Schedule:
Demand schedule is a tabular representation which shows functional relationship between price and quantity demanded for a particular commodity.
A Demand schedule may be either individual demand schedule or market demand schedule.
Individual Demand Schedule:
→ Individual demand schedule is a tabular representation of various quantities of a commodity demanded by an individual consumer at different prices during a given period of time.
This can be explained with the help of following schedule.
Individual Demand Schedule
| Price of Commodity ‘X’ (in ₹ ) | Quantity Demanded of Commodity ‘X’ (in kg) |
| 50 | 2 |
| 40 | 4 |
| 30 | 6 |
| 20 | 8 |
| 10 | 10 |
→ The above individual demand schedule shows an inverse relationship between price and quantity demanded of commodity ‘X’. At a higher price of ₹ 50 per kg. of commodity ‘X’, the demand is only 2 kg. of ‘X’ commodity and as price falls from ₹ 50 to ₹ 10, quantity demanded rises from 2 kg to 10 kg. of ‘X’ commodity.
![]()
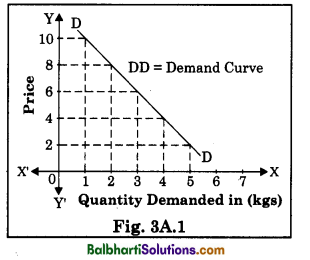
Individual Demand Curve:
It is a graphical representation of individual demand schedule. X-axis represents quantity demanded and Y-axis represents the price of the commodity. The demand curve DD slopes downward from left to right. It has a negative slope as price and demand are inversely related.
Market Demand Schedule:
→ Market Demand Schedule is a tabular representation of various quantities of a commodity demanded by different consumers at different prices during a given period of time. This can be explained with the help of following schedule –
Market demand schedule
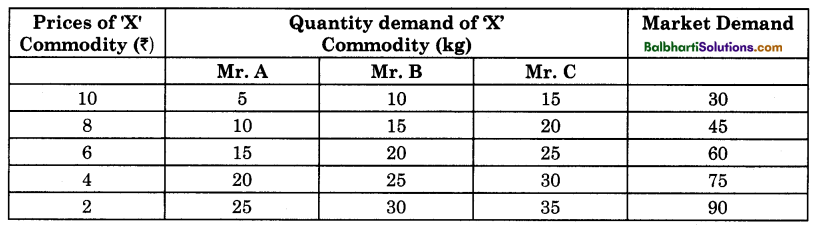
→ The above Market Demand Schedule shows an inverse relationship between price and market demanded of commodity ‘X’. At a high price of ₹ 10 per kg of commodity ‘X’, the market demand is only 30 kg and at a lower price of ₹ 2, market demand rises to 90 kg of commodity ‘X’.
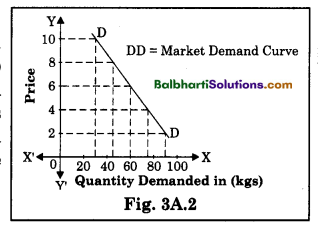
Market Demand Curve:
It is a graphical representation of market demand schedule. X-axis represents quantity demanded (Market Demand) and Y-axis represents the price of the commodity. When the above market demand schedule is plotted on this graph, we derive the market demand curve DD, which slopes downwards from left to right indicating inverse relationship between price and quantity demanded.
Reasons justifying downwards sloping demand curve:
→ The Law of Diminishing Marginal Utility: Marginal utility goes on diminishing when there is increase in the stock of commodity and consumer tends to buy more when price falls and vice-versa.
→ Income Effect: Whenever there is a fall in price of a commodity, purchasing power of a consumer gets increased, which enables him to buy more of that commodity.
→ Substitution Effect: When price of commodity rises consumer tends to buy more of cheaper substitute goods and less of the commodity whose price has increased.
→ Multi-purpose Uses: When a commodity can be used for satisfying multiple needs, its demand will rise with a fall in its price and vice-versa.
→ New Consumers : When there is fall in price of a commodity, a new consumer class buy the commodity as they can afford it. Thus, total demand for commodity increases with fall in price.
Types of Demand:
→ Direct Demand: When a commodity satisfies the want of a consumer directly, it is said to have direct demand. Demand for consumer goods like food, clothes, sugar, vegetables, milk, etc.
→ Indirect Demand: It refers to demand for goods which are required for further production. It is also called as derived demand. E.g. demand for factors of production like land, labour, capital, etc.
→ Joint or Complementary Demand: When two or more goods are demanded at a same time to satisfy single want, it is known as Joint or Complementary Demand. E.g. car and fuel, pen and ink, mobile phone and Simcard, etc.
→ Composite Demand: When one commodity can be utilized for several needs or multiple uses, it is known as Composite Demand. E.g. electricity, steel, coal, etc.
→ Competitive Demand: It is demand for those goods which are substitute for each other. E.g. tea or coffee, sugar or jaggery, Pepsi or Thumbs-up, etc.
![]()
Determinants of Demand:
→ Price: Demand for a commodity is mainly influenced by its price. Normally at a higher price the demand is less and at a lower price it is more. Thus, demand varies inversely with price of a commodity.
→ Income: Income determines the purchasing power of a consumer. Rise in income will lead to a rise in demand of a commodity and fall in income will lead to a fall in demand of a commodity.
→ Price of Substitute Goods: Demand for cheaper substitute goods will rise when there is fall in price of such goods. E.g. when sugar price rises then demand for jaggery will rise.
→ Price of Complementary Goods: Demand changes with changes in prices of complementary goods like car and petrol, etc.
→ Nature of Product: Under necessary and unavailable circumstances, the demand of a commodity will continue to be same irrespective of the corresponding price. E.g. medicine to control blood pressure.
→ Size of Population: Demand for commodity depends upon size and composition of population like age structure, gender ratio, etc. E.g. larger the child population more will be the demand for toys, chocolates, etc.,
→ Expectation about the Future Prices: If the consumer expect a rise in price in the near future, they will demand more at present price. Similarly, when they expect fall in price, then they will buy less at present price.
→ Advertisement: Effective advertisement and sales promotion will lead to greater demand for a product. E.g. cosmetics, toothbrush, etc.
→ Taste, Habits and Fashions: Habits influence market demand. If people habituated to the consumption of certain goods they will not give up such habits easily. E.g. demand for liquor, cigarettes, etc. Sometimes fashion change the attitude and preference of consumer, which in turn changes the market demand.
→ Level of Taxation: There would be increase in price of goods and services due to high rates of taxes which results in decrease in demand and vice-versa.
Other factors:
- Climatic condition
- Changes in technology
- Government policy
- Customs and Traditions, etc.
![]()
Law of Demand:
→ The law of demand is one of the important law of consumption which explains the functional relationship between price and quantity demanded of a commodity. Prof. Alfred Marshall in his book ‘Principles of Economics which was published in 1890, has explained the consumer’s behaviour as follows:
Statement of the Law:
→ According to Prof. Alfred Marshall, “Other things being equal, higher the price of a commodity, smaller is the quantity demanded and lower the price of a commodity, larger is the quantity demanded. ”
→ In other words, other things remaining constant,’ demand varies inversely with price. Marshall’s law of demand describes the functional relationship between demand and price. It can be presented as:
Dx = f (Px) [where D = Demand for Commodity
x = Commodity
f = function
Px = Price of a commodity]
Assumptions to Law of Demand:
→ Constant Level of Income: Consumer’s income must remain unchanged because if income increases consumer may buy more even at a higher price not following the law of demand.
→ No Change in Size of Population: The size of population, gender ratio and age composition are assumed to remain constant. As such changes are sure to affect demand.
→ Prices of Substitute Goods remain constant: The price of substitute goods should remain unchanged as change in the price will affect the demand for the commodity.
→ Prices of Complementary Goods remains constant: A change in the price of one goodwill affect the demand for other, thus the prices of complementary goods should remain unchanged. No expectation
→ about Future Changes in Prices: Consumer’s expectation of change in price of a commodity in future will affect his present consumption.
→ No Change in Tastes, Habits, Preferences, Fashions, etc.: If the taste changes, then the consumer’s preference also will change which will affect demand. When commodities are out of fashion, then their demand will be low even at a low price.
→ No change in Taxation Policy: The level of direct and indirect tax imposed by the government on the income and goods should remain constant.
![]()
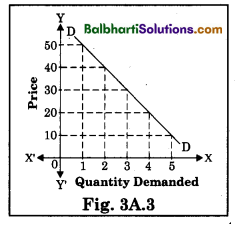
Demand Schedule and Demand Curve:
The law of demand is explained with the help of the following demand schedule and diagram:
Demand Schedule
| Price of Commodity ‘X’ (in ₹) | Quantity Demanded of Commodity ‘X’ (in kgs) |
| 50 | 1 |
| 40 | 2 |
| 30 | 3 |
| 20 | 4 |
| 10 | 5 |
From the above demand schedule we observe that at a higher price of ₹ 50 per kg, quantity demanded is 1 kg. When price falls from ₹ 50 to ₹ 40, quantity demanded rises from 1 kg to 2 kg. Similarly, at price ₹ 30 quantity demanded is 3kg and when price falls from ₹ 20 to ₹ 10 quantity demanded rises from 4 kg to 5 kg. This shows an inverse relationship between price and demand.
In the above diagram, ‘X’-axis represent quantity demanded and ‘Y’- axis represent the price of the commodity. The demand curve DD slopes downwards from left to right showing an inverse relationship between price and demand. It has a negative slope.
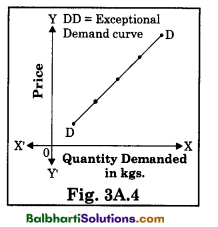
Exceptions to the Law of Demand:
There are some important cases in which the demand for the commodity is greater when price rises and smaller when price falls. Such cases are called exceptions to the law of Demand. In such case, demand curve slopes upwards from left to right and it has a positive slope.
→ Giffen Paradox: Demand for low-quality goods and inferior goods decrease even if there prices falls.
According to Sir Robert Giffen when price of bread declined, people did not buy more because of increase in their real income and they preferred to buy superior goods like meat.
→ Prestige Goods: Rich people buy more expensive goods like gold, diamonds, etc., even when there prices are high to maintain their status.
→ Speculation: People are tend to buy more commodities if they expect prices to rise further. E.g. prices of oil, sugar, etc. are expected to rise before Diwali, so people buy more of these commodities even at higher price.
→ Price Illusion: Consumer feels that goods at higher price are of better quality, therefore demand for such goods are higher even at rise in their prices.
→ Ignorance : Sometimes people completely ignore the price of commodity and buy more of that commodity ignoring higher price.
→ Habitual Goods: Due to habit of consumption, certain goods like tea is purchased in required quantities even at higher price.
![]()
Variations in Demand:
Variations in Demand refers to change in quantity demanded for a commodity due to change in price alone and other factors remaining constant.
There are two types of variations in demand.
They are (1) Expansion or Extension of Demand (2) Contraction of Demand
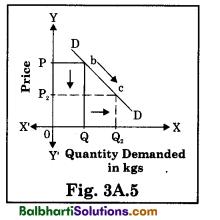
→ Expansion or Extension of Demand: It refers to rise in quantity demanded due to fall in price and other factors like tastes, income, etc. remaining unchanged.
→ It is shown by a downward movement on the same demand curve. In the given diagram,’ DD is the demand curve which is showing downward movement on the same demand curve from point ‘b’ to point ‘c’ and indicates an expansion of demand.
→ Contraction of Demand: It refers to fall in quantity demanded due to rise in price and other factors like tastes, income, population, etc. remaining unchanged.
→ It is shown by an upward movement on the same demand curve. In the given diagram, DD is the demand curve which is showing upward movement on the same demand curve from point ‘c’ to point ‘a’ and indicates contraction of demand.
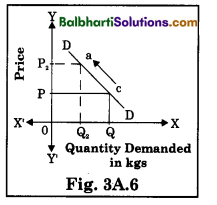
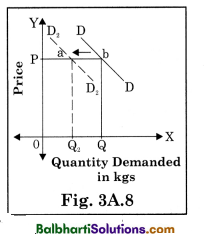
Changes in Demand:
Changes in demand refers to change in quantity demanded due to change in other factors while price remaining constant.
There are two types of changes in demand.
They are : (1) Increase in Demand (2) Decrease in Demand
→ Increase in Demand: It refers to rise in quantity demanded due to favourable changes in other factors like tastes, income, etc. and price remaining constant.
→ Demand curve shifts to the right-hand side of the original Demand curve. In the given diagram DD is the original demand curve. D1D1 demand curve indicates increase in demand by shifting towards the right side of original demand curve from point bb to point ‘c’.
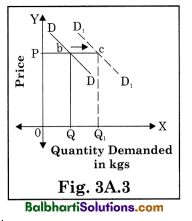
→ Decrease in Demand: It refers to fall in quantity demanded due to unfavourable changes in other factors like tastes, income, etc. Demand curve shift to the left-hand side of the original Demand curve. In the given diagram DD is the original demand curve. D2, D2, demand curve indicates decrease in demand by shifting towards the left-hand side Quantity Demanded of original demand curve from point ‘b’ to point ‘a’.