By going through these Maharashtra State Board Class 11 Economics Notes Chapter 4 The Economy of Maharashtra students can recall all the concepts quickly.
Maharashtra State Board Class 11 Economics Notes Chapter 4 The Economy of Maharashtra
→ Maharashtra State has been divided into 36 districts.
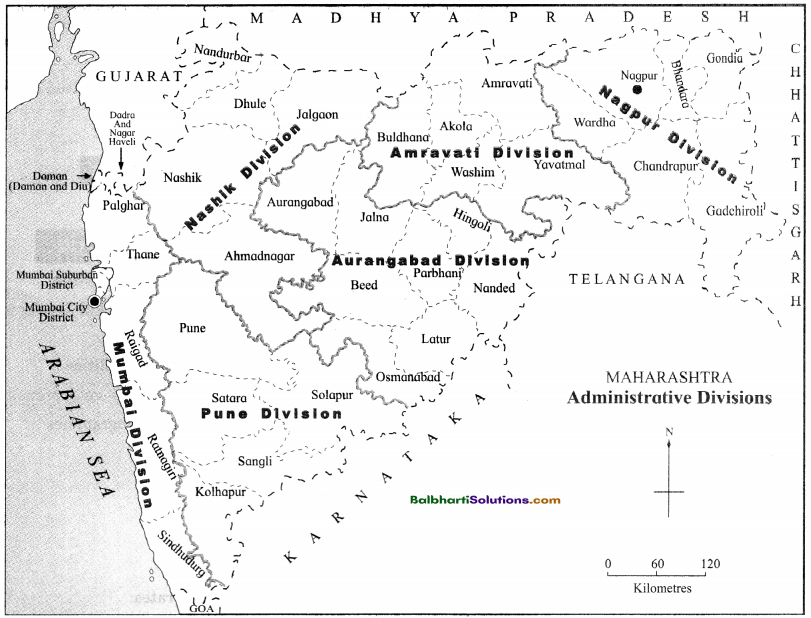
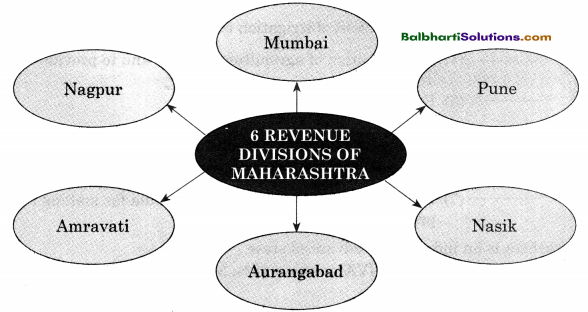
→ 6 Revenue Divisions of Maharashtra
- Mumbai
- Pune
- Nasik
- Aurangabad
- Amravati
- Nagpur
![]()
→ Features Of Maharashtra Economy
- Abundant natural resource, skilled manpower, technologically advanced infrastructure, etc.
- Highest GSDP & SPCI as compared to other states.
- Literacy rate 82.3% – 2011 Census
- Most favoured destination for creativity, skill, development, tourism and investment.
- Sex Ratio L929 females per 1000 males
- 2nd 1arges populated F4ate country (11.24 crores- Census 2011)
- 3rd largest state in country in terms of geographical area. (3.08 lacs sq. km)
- Most urbanised state

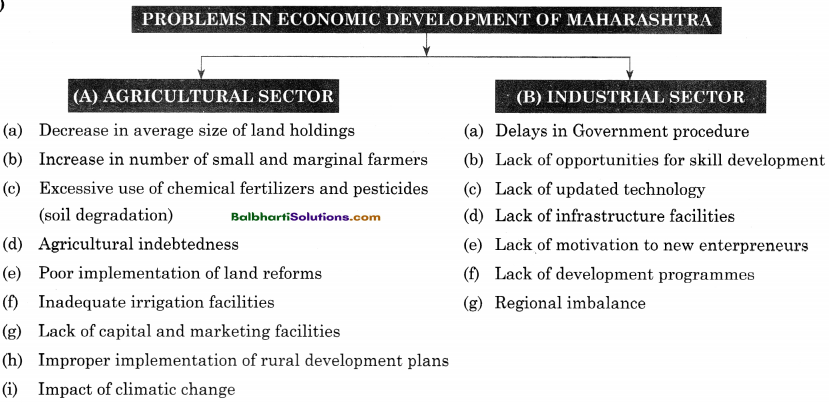
→ Problems In Economic Development Of Mahakashtra
- Agricultural Sector
- Industrial Sector
1. Agricultural Sector:
- Decrease in average size of land holdings
- Increase in number of small and marginal farmers
- Excessive use of chemical fertilizers and pesticides (soil degradation)
- Agricultural indebtedness
- Poor implementation of land reforms
- Inadequate irrigation facilities
- Lack of capital and marketing facilities
- Improper implementation of rural development plans
- Impact of climatic change
2. Industrial Sector:
- Delays in Government procedure
- Lack of opportunities for skill development
- Lack of updated technology
- Lack of infrastructure facilities
- Lack of motivation to new enterpreneurs
- Lack of development programmes
- Regional imbalance
![]()
→ Measures Undertaken By The Govt. For – Agricultural Development:
- Distribution of quality seeds at reasonable rates.
- Number of outlets increased for fertilizer and pesticide distribution. Development of irrigation facilities.
- Electrification of agricultural pumps and to provide electricity on demand.
- Provide financial assistance.
- Setting up of APMC, Establishment of agro export zones, horticultural training centres, grading and packing facilities.
- Create awareness by use of mass media for making agriculture a profit making business.

→ Industry : Maharashtra is an industrially advanced state.
The share of industry in Net Value Added (NVA) is about 18%. Maharashtra is the first choice of domestic and foreign investor.
Maharashtra is ranked as number one investment destination in India.
Maharashtra is in forefront in terms of FDI inflow in India.
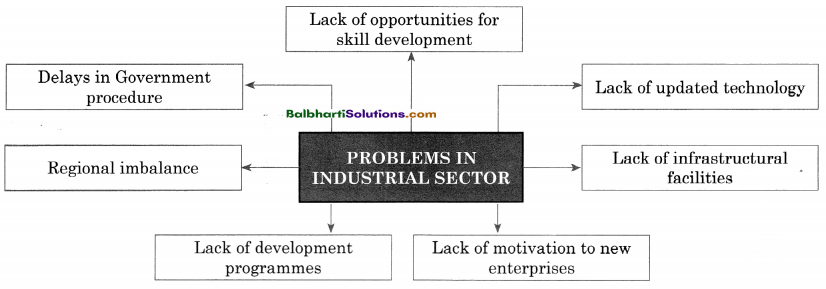
→ Problems In Industrial Sector:
- Lack of opportunities for skill development
- Delays in Government procedure
- Lack of updated technology
- Regional imbalance
- Lack of infrastrucLural facilities
- Lack of development programmes
- Lack of motivation to new enterprises
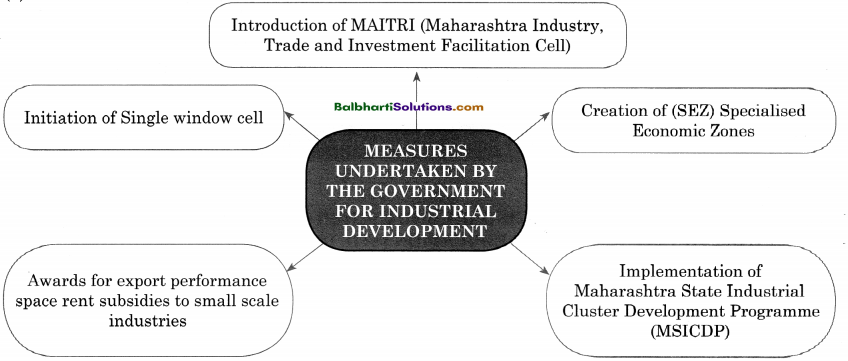
→ Measures Undertaken By ‘The Government For Industrial Development:
- Introduction of MAITRI (Maharashtra Industry, Trade and Investment Facilitation Cell)
- Awards for export performance space rent subsidies to small scale industries
- Introduction of MAITRI (Maharashtra Industry, Trade and Investment Facilitation Cell)
- Initiation of Single window cell
- Creation of (SEZ) Special: Economic Zones
- Implementation of Maharashtra State Industrial Cluster Development Programme (MSICDP)
![]()
→ Service Sector :
- It consists of – insurance, tourism, retail banking, education and social services.
- It provides services to business sector as well as final consumers.
- It is largest employment generating and fastest growing sector.
- Core area of service sector includes – Fintech, IT/ITES, start ups, cloud computing, electric vehicles, defence, tourism and private universities.
→ Core Area Of Service Sector:
- Infrastructure
- Tourism
- Hospitality
- Entertainment Industry
Infrastructure:
- Economic Infrastructure
- Social Infrastructure
Economic Infrastructure:
- Energy
- Transport
- Communication
Social Infrastructure:
- Health
- Education

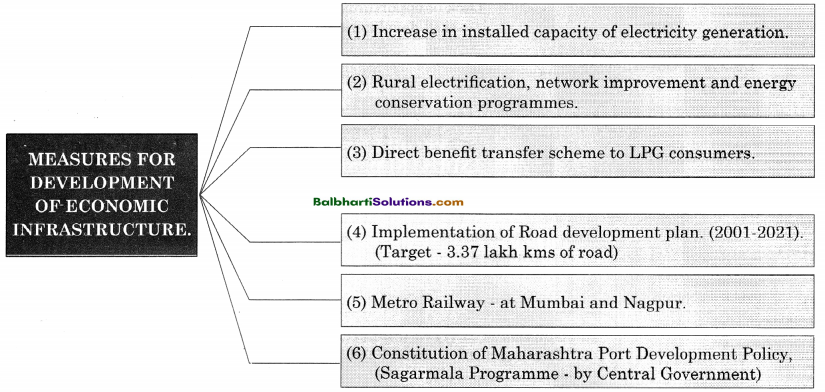
→ Measures for development of Economic Infrastructure:
- Increase in installed capacity of electricity generation.
- Rural electrification, network improvement and energy conservation programmes.
- Direct benefit transfer scheme to LPG consumers.
- Implementation of Road development pIan. (2001 .2021).
(Target – 3.37 lakh kms of road) - Metro Railway – at Mumbai and Nagpur.
- Constitution of Maharashtra Port Development Policy,
(Sagarmala Programme- by Central Government)
![]()
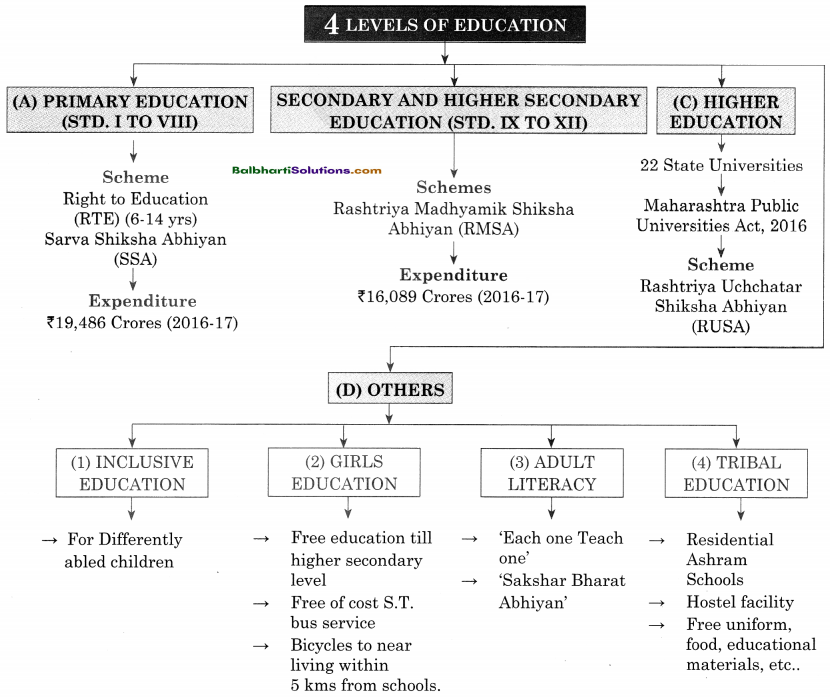
→ 4 Levels of Education:
- Primary Education (STD. I To VIII)
- Secondary and Higher Secondary Education (STD. IX to XII)
- Higher Education
- Others:
1. Primary Education (STD. I To VIII)
- Scheme: Right to Education (RTE) (6-14 yrs)
- Sarva Shiksha Abhiyan(SSA)
- Expenditure: ‘19,486 Crores (2016-17)
2. Secondary and Higher Secondary Education (STD. IX to XII)
- Schemes: Rashtriya Madhyamik Shiksha Abhiyan (RMSA)
- Expenditure : Rs. 16,089 Crores (2016-17)
3. Higher Education:
- 22 State Universities
- Maharashtra Public Universities Act, 2016
- Scheme : Rashtriya LJchchatar Shiksha Abhiyan (RUSA)
4. Others:
- Inclusive Education
- Girls Education
- Adult Literacy
- Tribal Education
Inclusive Education:
For Differently abled children
Girls Education:
- Free education till higher secondary level
- Free of cost S.T. bus service
- Bicycles to near living within 5 kms from schools.
Adult Literacy:
- ‘Each one Teach one’
- ‘Sakshar Bharat Abhiyan
Tribal Education:
- Residential Ashram Schools
- Hostel facility
- Free uniform, food, educational materials, etc.
![]()
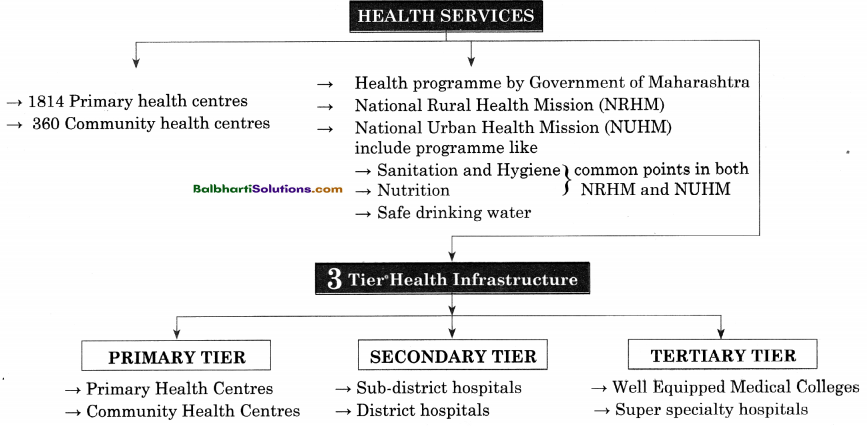
→ Health Services:
- 1814 Primary health centres
- 360 Community health centres
- Health programme by Government of Maharashtra
- National Rural Health Mission (NRHM)
- National Urban Health Mission (NUHM) include programme like
- Sanitation and Hygiene (common points in both NRHM and NUHM)
- Nutrition (common points in both NRHM and NUHM)
- Safe drinking water
3 Tier”Health Infrastructure:
- Primary Tier
- Secondary Tier
- Tertiary Tier
Primary Tier
- Primary Health Centres
- Community Health Centres
Secondary Tier
- Sub-district hospitals
- District hospitals
Tertiary Tier
- Well Equipped Medical Colleges
- Super specialty hospitals
→ Tourism (Maharashtra Tourism Policy, 2016)
Objectives:
- to make Maharashtra a leading tourist destination by 2025.
- to attract investments of ? 30,000 Crore.
- to create additional jobs
Nodal Agency: → Maharashtra Tourism Development Corporation (MTDC)
“Mahabhraman” → (agro tourism, village tourism, food tourism, safaris, etc.)

![]()
→ Hospitality:
- Hotel Industry
- Transportation
- Event Management
- General Tourism
- Restaurants
Transportation
- Airlines
- Mumbai – Goa Cruiseship
- Fancier Trains (Deccan Odyssey)

→ Entertainment Industry:
- Largest number of films in world Generates
- Generates employment opportunities
- Koihapur – well known for regional films
- Mumbai – Popularly called as ‘Bollywood’.

→ Co-operative Movement in Maharashtra:
Objectives:
- To develop rural areas.
- To improve socio-economic conditions of under-privileged
- To develop agro-processing and agro marketing.
- To support sugar co-operatives, fisheries co-operative and dairy co-operatives.

Word Meaning:
revenue divisions – administrative division to collect government revenue and lower its expenses, geographical area – physical features of an area, urbanized – people staying in city or town, census – a survey of counting of population, literacy rate – percentage of population who can read and write, characterised – features, abundant- plenty, resources – stock of something, infrastructure – basic structure like buildings, roads, bridges, etc. destination – place to visit, allied – joined, declining – decreasing, trend – direction, average – mean, marginal – very small, excessive – more, degradation – low in quality, indebtness – to owe something, implement – to do it / to carry out, adverse – poor, inadequate – not sufficient, reasonable – low cost, electrification – use of electricity, assistance – to help, agro – agriculture based, awareness – to make understand/ to bring to notice, mass media – communication to people through TV, Radio, Newspaper, etc, potential – capable possibility, diversification – to change the line of business, amend – to make changes, liberalisation – removal of restrictions, opportunities – chances, motivation – willingness to do something, clearances – to clear/ to give pass away, consolidate – to combine, subsidies – grant/allowaness, retail banking – banking services provided to general /public, core – important/essential/significant, expand – to enlarge, rapid – fast, sustainable – to maintain, achievement – to do something successfully, energy conservation – preventing the waste of energy, integrated – linked together, subscriber – member, components – a part of something, stimulate – to encourage, backbone – to support, scenario – situation, priority – more important, compulsory – essential, universalization – through out, veterinary- study related to animal diseases and it treatments, autonomous – independent, privatization – transfer of public company to private ownership, globalization – all over the world, concession – discount, emphasizes – to give special attention, strengthen- to build up, sanitation – to provide clean drinking water and sewage disposal, hygiene – cleanliness, nutrition – obtaining necessary food for health, three tier – three level, comprehensive – inclusive, tertiary – service sector, abroad – foreign, agro tourism – agriculture based tourism, manifold – numbers /multiple, cruiseship – passenger ship used for travelling with amenities within it, impact – effect, underprivileged – needy, solidarity – mutual support, subsequently – afterward.

